By Dave Parker, Flickr: 8/365 Rain is back, CC BY 2.0, http://creativecommons.org/licenses/by/2.0, via Wikimedia Commons
Water
Climate change will continue to cause profound changes in the water cycle, increasing the risk of flooding, drought, and degraded water supplies for both people and ecosystems. While data and tools for water resources planning are improving, water infrastructure standards and management policies have been slow to meet the new challenges.
- Climate change will continue to cause profound changes in the water cycle
- Water cycle changes will affect all communities, with disproportionate impacts for some
- Progress toward adaptation has been uneven
From the Water chapter of the Fifth National Climate Assessment.
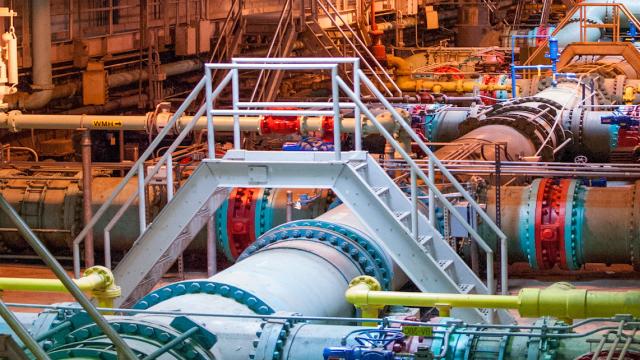
Blue Plains Advanced Wastewater Treatment Plant. Photo by Alicia Pimental, Chesapeake Bay Program, CC BY-NC 2.0, https://creativecommons.org/licenses/by-nc/2.0/
Looking for previous narratives?
Featured resources
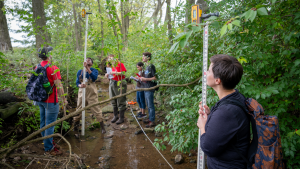
Ellen Wagner. CC-BY-NC-ND 2.0, https://creativecommons.org/licenses/by-nc-nd/2.0/, via Flickr
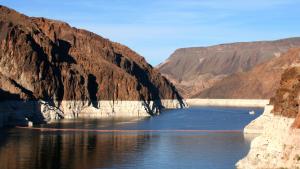
Drought at Lake Mead. Photo by Chris Richards, via WikiMedia Commons. Attribution-NonCommercial-NoDerivs 2.0 Generic (CC BY-NC-ND 2.0)

Si'u Point Trail, Ta'u Island, National Park of American Samoa, Department of the Interior, via Flickr. Used via a Creative Commons license, CC BY-SA 2.0, https://creativecommons.org/licenses/by-sa/2.0/
Related Case Studies & Action Plans

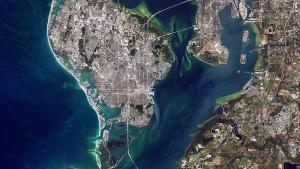
This image has been released into the public domain because it contains materials that originally came from the United States National Aeronautics and Space Administration (NASA). No endorsement by licensor implied.
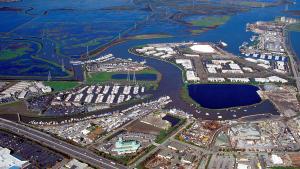
This photo has been released into the public domain because it contains materials that originally came from the U.S. Army Corps of Engineers. No endorsement by licensor implied.