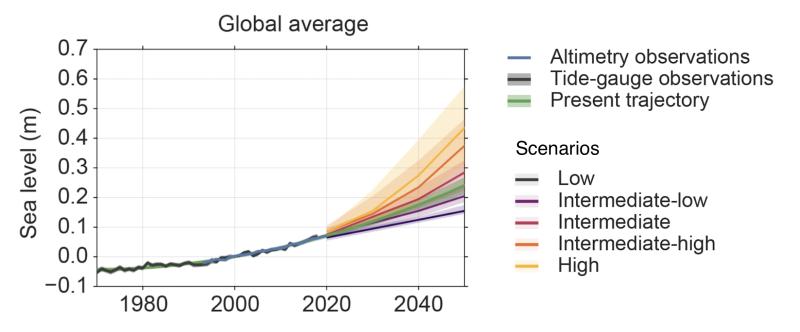
Observation-based extrapolations from tide-gauge data and projections for five scenarios, in meters, for global mean sea level relative to a baseline of 2000. Median values are shown by the solid lines; shaded regions represent the likely ranges for the observation-based extrapolations and projections for each scenario. Altimetry data (1993–2020) and tide-gauge data (1970–2020) are overlaid for reference.
Page/s that contain this image:
Last modified:
5 April 2022 - 11:23am

