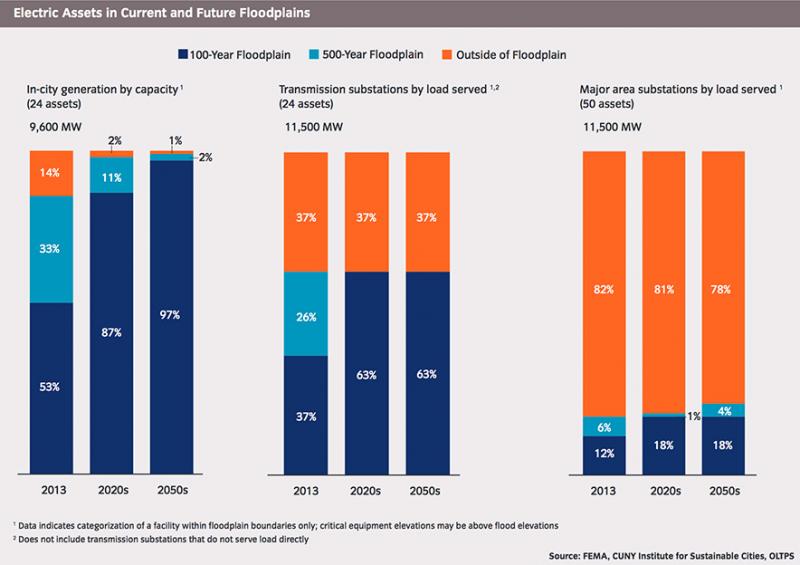
The graphs—from the A Stronger, More Resilient New York report—show New York City's electric assets located in the 100-year floodplain (dark blue bars), 500-year floodplain (light blue bars), and outside the floodplain (orange bars). Click on the image for a larger view.
Page/s that contain this image:
Last modified:
9 July 2015 - 2:27pm

