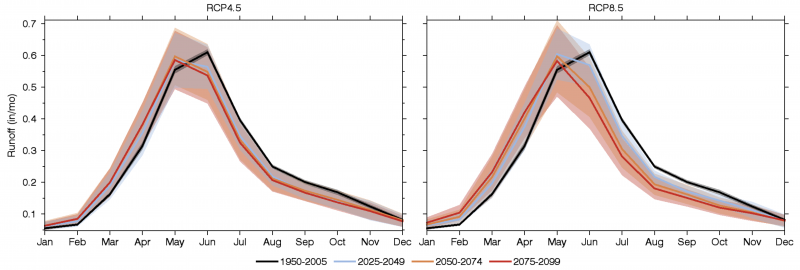
Monthly averages of runoff across the Missouri River Basin for four time periods for the RCP4.5 (left) and RCP 8.5 (right) emission scenarios based on 30 CMIP5 global climate model projections. Solid lines indicate average values and shaded envelopes indicate standard deviations. These results indicate earlier peak runoff, increases in runoff volume between January and May, and decreases in runoff volume between June and November. Click on the image for more information.
The graphs were created using the National Climate Change Viewer developed by the U.S. Geological Survey. Alder, J. R. and S. W. Hostetler, 2013. USGS National Climate Change Viewer. U.S. Geological Survey: http://www.usgs.gov/climate_landuse/clu_rd/nccv.asp, doi:10.5066/F7W9575T.

