Mapping Social Vulnerabilities to Enhance Resilience in Richmond
- Think big, act small: To enhance city-wide climate resilience, start at the neighborhood level. Thoroughly examining neighborhood-specific inputs informs customized resilience planning ultimately yielding robust citywide resilience.
- Don’t reinvent the wheel: At the project outset, leverage existing resources to gain wisdom and learn from past projects. This can also foster community engagement, enabling collaborative approaches that strengthen resolve and amplify efforts.
- Come one, come all: Embrace complexity, diversity, and intersections. This fosters deeper understanding and lays the groundwork for innovative solutions.
- Accessibility is key: Making project results available to all enhances awareness and fortifies resilience planning.
- Get by with a little help from your friends: Lean on community feedback and contributions. This fosters diverse perspectives, enhancing the capacity for tailored solutions and strategies. The target community is the most valuable resource for refining plans and ensuring long-term effectiveness.
The strong focus on social vulnerability exhibited in this project enables it to address climate resilience and equity concerns in Richmond head on. By considering inequities shaped by a history of discriminatory policies, this project disrupts the perpetuation of systemic inequities that have historically prevailed. In its place, this project lays the groundwork for a distributionally, structurally, and culturally equitable climate action plan.
While developing the Climate Equity Index (CEI), Richmond intentionally incorporated a diverse array of demographic, health, and housing data into the database. As such, the CEI has proved an effective tool for determining areas of vulnerability as it genuinely reflects the diversity and standing inequities of Richmond. With this tool, decision makers can evaluate equity concerns and develop tailored policies and strategies to bolster city climate resilience.
The tool's accessibility facilitates local community access and contribution, granting residents the ability to provide invaluable input regarding the assets and vulnerabilities of their respective neighborhoods. Herein, community members can play a key role in the development of policies and strategies that directly impact them. Further, the tool evolves with the addition of new data, ensuring the tool remains relevant to the time period and communities and that it will continue highlighting pertinent inequities under changing circumstances.
Click to read the full case study
Coming to grips with inequity
Located in the rolling hills of the Virginia Piedmont along the James River, Richmond—the state capital—is a historic and diverse city that encompasses a number of unique neighborhoods. Throughout the city's history, discriminatory policies have shaped these neighborhoods, establishing and entrenching inequities among its residents. The legacy of policies that favor one group over another is now a major hurdle that must be cleared in order to build the city's resilience.
Richmond is not alone in this problem. Social vulnerability to climate change is a growing concern that communities across the United States must face. Factors such as poverty, lack of access to transportation, and crowded housing can weaken a community’s ability to respond to disaster; the same factors are associated with an increased risk of human suffering and economic loss.1
Creating the Climate Equity Index
To build resilience for a whole city, efforts must acknowledge and account for the varying level of social vulnerability in neighborhoods across the community.
Alicia Zatcoff, Richmond’s Sustainability Manager, came to this realization during the pre-planning phase of RVAgreen 2050, the city’s equity-centered climate action and community resilience planning initiative. As Zatcoff and her team used the Steps to Resilience to develop a Climate Vulnerability and Risk Assessment for RVAgreen 2050, they quickly recognized the need for a social vulnerability analysis to inform the overall process.
The team didn’t need to start from scratch to develop their analysis. They started by researching examples and checking best practice documents from other cities. Through this review, they identified factors they could use to determine the relative vulnerability of each census tract to climate impacts such as rising temperatures, changing precipitation patterns (including flooding), and sea level rise. Based on their research, the team selected 39 data sets comprising demographic, health, and housing information for their analysis.
After a year of research and development, the Climate Equity Index (CEI) launched in 2020. This novel interactive tool shows vulnerability to climate impacts across Richmond neighborhoods. The tool can also narrow in on factors that can help decision makers develop policies and strategies to better plan for citywide resilience. The CEI tool also has the ability to evolve as new situations arise. One example is the recent addition of a layer showing vulnerability to COVID-19. And best of all, the tool is available and accessible to everyone.
The Climate Equity Index in use
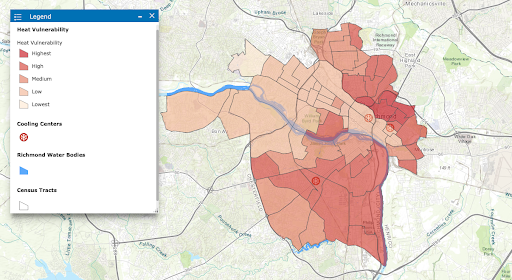
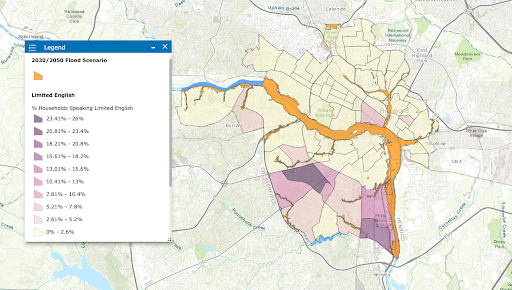
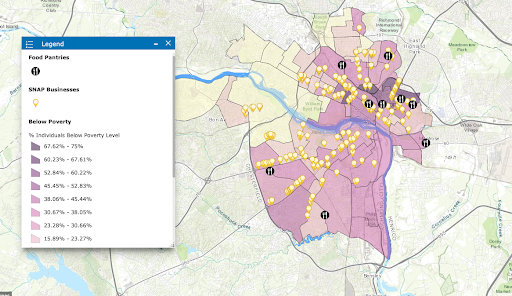
With the ability to overlay maps, the CEI tool provides valuable data-based visuals for community resilience policies and strategies. For example:
Overlaying a map of heat-sensitive residents with the locations of cooling stations can help users determine if vulnerable populations have the ability to get to cooling centers during a heat wave.
(To learn more about how Richmond is mapping urban heat vulnerability, see the case study Where Do We Need Shade? Mapping Urban Heat Islands in Richmond, Virginia.)
Overlaying maps of flood scenarios with households speaking limited English can help users determine where evacuation notices would need to be sent out in multiple languages.
Overlaying maps of low-income households with SNAP and food pantry locations can help show areas where people don't have access to proper nutrition.
Creating a more resilient Richmond
With the Climate Equity Index live and available for public use, Zatcoff and her team are now looking for additional input on the RVAgreen 2050 equitable climate action and resilience plan. Citizens can see their neighborhood in the mapping tool, provide feedback on their community’s assets and potential vulnerabilities, and provide input to indicate if they feel the map offers an accurate reflection of their community. Using community feedback, the City of Richmond aims to have the city-wide RVAgreen 2050 climate action and resilience plan in place by Earth Day 2022.
Need help checking social vulnerability in your community?
Are you interested in mapping the social vulnerability of your city but don’t know where to start? The Centers for Disease Control has created a Social Vulnerability Index that uses 15 U.S. census variables to help local officials identify communities that may need support before, during, or after a disaster.
Relevant Options
This selection of resilience actions from our Options Database is specifically tailored to address the hazards and assets identified in this case study. To explore other resilience actions that may be applicable to your community, visit the complete Options Database.
- 1. U.S. Department of Health and Human Services, Agency for Toxic Substances and Disease Registry. CDC/ATSDR SVI Fact Sheet.
Trisha Porter, MNR, SEA, and Annette Osso, LEED AP, Managing Director, Resilient Virginia.
Richmond, VA Skyline, cropped, by Jc7792, CC BY-SA 4.0, https://creativecommons.org/licenses/by-sa/4.0, via Wikimedia Commons. https://commons.wikimedia.org/w/index.php?curid=94551850


