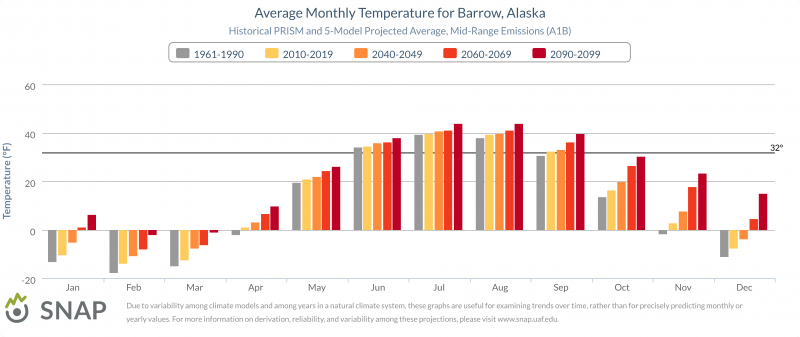
This average monthly temperature chart for Barrow, Alaska—depicting historical and projected temperatures—was generated by the SNAP Community Charts tool.
Source:
The graph shows the calculated mean annual temperatures in the active layer (at the depth of eight centimeters) and near-surface permafrost (between 0.5 and 15 meters), using a model calibrated for the Barrow site and data from the Barrow meteorological station.
Page/s that contain this image:
Last modified:
10 July 2015 - 1:13pm

