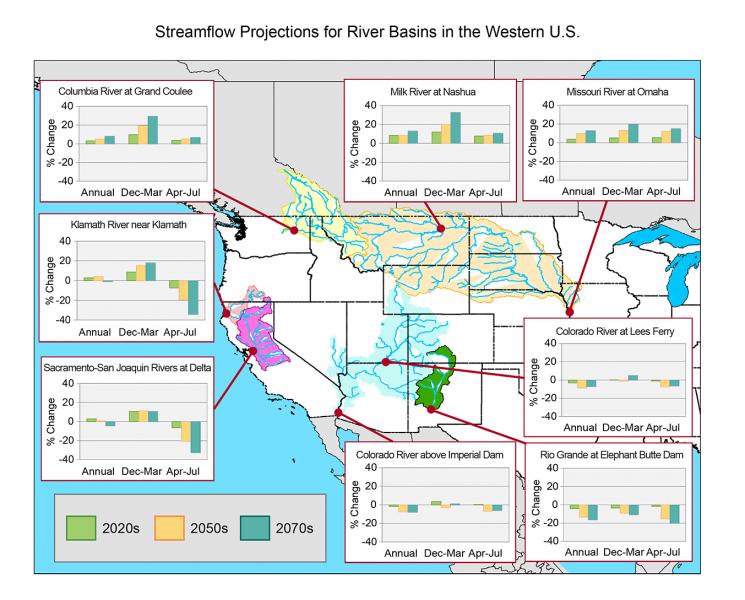
Annual and seasonal streamflow projections for eight river basins in the western United States. The panels show percentage changes in average runoff, with projected increases above the zero line and decreases below. Click the image for a larger view.
The streamflow projections are based on the B1 (with substantial emissions reductions), A1B (with gradual reductions from current emission trends beginning around mid-century), and A2 (with continuation of current rising emissions trends) CMIP3 scenarios. Projections are for annual, cool, and warm seasons, for three future decades (2020s, 2050s, and 2070s) relative to the 1990s. This figure appears in chapter 3 of the report "Climate Change Impacts in the United States: The Third National Climate Assessment." Source: U.S. Department of the Interior, Bureau of Reclamation 2011; data provided by L. Brekke, S. Gangopadhyay, and T. Pruitt. Public domain.

