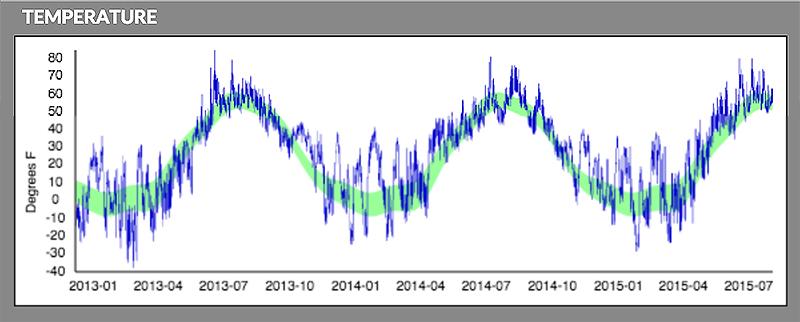
Long-term average temperature (green) compared to daily observations (blue) at Kotzebue, Alaska, for January 2013 through July 2015. The graph reveals the highly variable and often extreme weather (especially in winter) that is common in Alaska and the Arctic.
Source:
Page/s that contain this image:
Last modified:
3 January 2017 - 4:29pm

