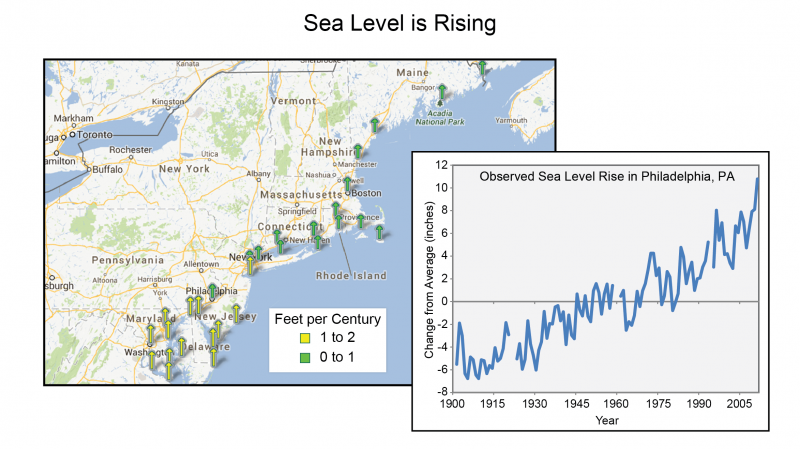
(Map) Local sea level trends in the Northeast region. (Graph) Observed sea level rise in Philadelphia, PA, has significantly exceeded the global average of eight inches over the past century, increasing the risk of impacts to critical urban infrastructure in low-lying areas. Over 100 years (1901–2012), sea level increased 1.2 feet.
Source:
Map: Length of time series for each arrow varies by tide gauge location. Map Source: National Oceanic and Atmospheric Administration, National Ocean Service, Sea Level Trends website (https://tidesandcurrents.noaa.gov/sltrends/). Graph: Data from Permanent Service for Mean Sea Level.
Page/s that contain this image:
Last modified:
9 August 2021 - 2:52pm

