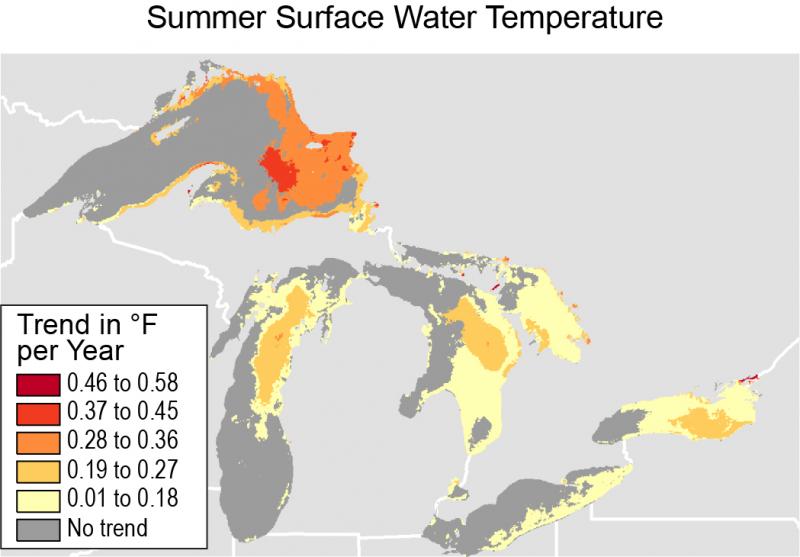
Summer surface water temperature increased in most areas of the Great Lakes between 1994 and 2013; the map shows the rate of change. The greatest rates of increase occurred in deeper water, with smaller increases occurring near shorelines.
Source:
Source: Adapted from Mason, L.A., C.M. Riseng, A.D. Gronewold, E.S. Rutherford, J. Wang, A. Clites, S.D.P. Smith, and P.B. McIntyre, 2016. "Fine-scale spatial variation in ice cover and surface temperature trends across the surface of the Laurentian Great Lakes." Climatic Change 138(1), 71-83. http://dx/doi/org/10.1007/s10584-016-1721-2. Used with permission from Springer.
Page/s that contain this image:
Last modified:
6 December 2018 - 9:26am

