Display Image
Image
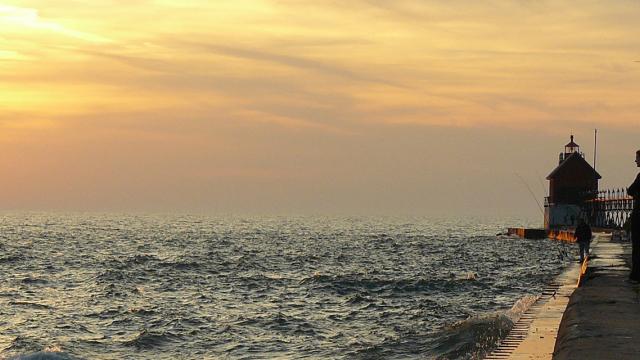
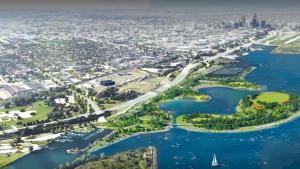
Grand Haven, Lake Michigan. Image credit: D. O'Keefe, Michigan Sea Grant
Region
Great Lakes
Increases in extreme precipitation events, changes in growing seasons, and warming temperatures impact the people, ecosystems, and infrastructure of the Great Lakes region—and the lakes themselves.
Learn more about climate in the Great Lakes Region in the Midwest and the Northeast chapters of the Fifth National Climate Assessment.
Title
Key Messages
Text
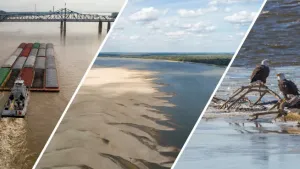
- Extreme rainfall events have increased over the last century, and these trends are expected to continue. Combined with land cover changes, increased precipitation has and likely will continue to lead to flooding, erosion, declining water quality, and negative impacts on transportation, agriculture, human health, and infrastructure.
- In the next few decades, longer growing seasons and rising carbon dioxide levels will increase yields of some crops; those benefits will be progressively offset by extreme weather events. In the long term, the combined stresses associated with climate change are expected to decrease agricultural productivity.
- The composition of forests in the Great Lakes is changing as the climate warms. Many tree species are shifting northward, with more southerly varieties replacing them. Many iconic north wood tree species will lose their advantage and be slowly replaced over the next century.
- Increased heat wave intensity and frequency, increased humidity, degraded air quality, reduced water quality, and change in vector-borne disease patterns will increase public health risks.
- The Great Lakes region has a highly energy-intensive economy, with per capita emissions of greenhouse gases more than 20 percent higher than the national average. The region also has a large and increasingly utilized potential to reduce emissions that cause climate change.
- Climate change will exacerbate a range of risks to the Great Lakes, including changes in the range and distribution of some species, increases in invasive species and harmful blooms of algae, and declines in beach health.
- Ice cover declines will lengthen the commercial navigation season.
- At-risk communities in the Great Lakes are becoming more vulnerable to climate change impacts such as flooding, drought, and increases in urban heat islands. Tribal nations are especially vulnerable because of their reliance on threatened natural resources for their cultural, subsistence, and economic needs. Integrating climate adaptation into planning processes offers an opportunity to better manage climate risks now. Developing knowledge for decision making in cooperation with vulnerable communities and tribal nations will help to build adaptive capacity and increase resilience.
Adapted from the Synthesis of the Third National Climate Assessment for the Great Lakes Region and the Midwest chapter of the Fourth National Climate Assessment.
Image
Looking for previous content for the Great Lakes region?
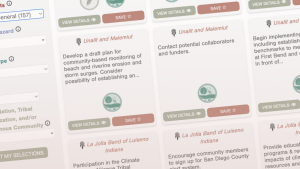
Related Case Studies & Action Plans
Image

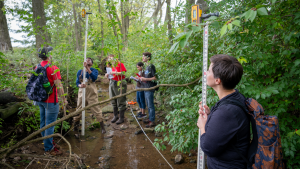
Maria Salem/FWS
Image
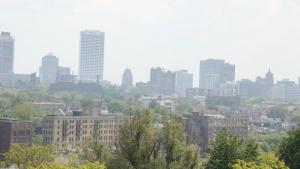
The Milwaukee Skyline in Smog, by Jeramey Jannene, via Flickr. Used via Creative Commons License CC BY 2.0.
Related Tools
Image
NOAA NIDIS
Image
Image