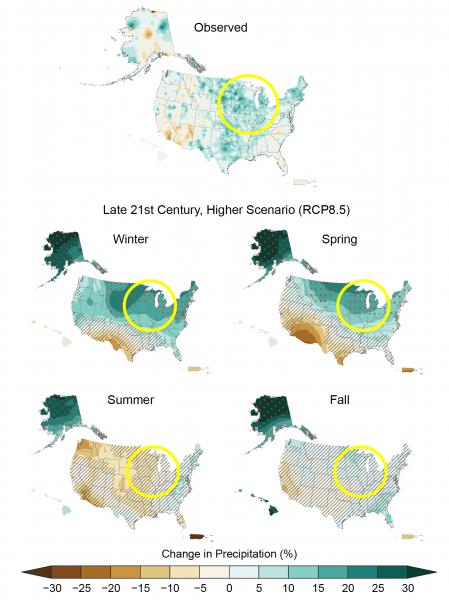
Observed and projected precipitation changes vary by region and season. Click the image for more information and a larger view.
(top) Historically, the Great Plains and the northeastern United States have experienced increased precipitation while the Southwest has experienced a decrease for the period 1986–2015 (relative to 1901–1960 for the contiguous United States and 1925–1960 for Alaska, Hawai‘i, Puerto Rico, and the U.S. Virgin Islands). (middle and bottom) In the future, under the higher scenario, the northern United States is projected to receive more precipitation, especially in the winter and spring by the period 2070–2099 (relative to 1986–2015). Areas with red dots show where projected changes are large compared to natural variations; areas that are hatched show where changes are small and relatively insignificant. Yellow circles added to highlight the Midwest region. Source: adapted from Easterling et al. 2017.

