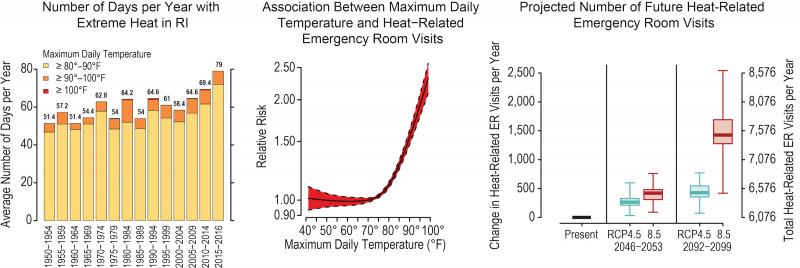
This figure shows observed and projected impacts of excess heat on emergency room visits in Rhode Island via three graphs. On the left, maximum daily temperatures in the summer have trended upwards over the last 60 years. In the center, data shows that heat-related ER visits rose sharply as maximum daily temperatures climbed above 80°F. On the right, with continued climate change, Rhode Islanders could experience an additional 400 (6.8% more) heat-related ER visits each year by 2050 and up to an additional 1,500 (24.4% more) such visits each year by 2095 under the higher scenario (RCP8.5).
Dupigny-Giroux, L.A., E.L. Mecray, M.D. Lemcke-Stampone, G.A. Hodgkins, E.E. Lentz, K.E. Mills, E.D. Lane, R. Miller, D.Y. Hollinger, W.D. Solecki, G.A. Wellenius, P.E. Sheffield, A.B. MacDonald, and C. Caldwell, 2018: Northeast. In Impacts, Risks, and Adaptation in the United States: Fourth National Climate Assessment, Volume II [Reidmiller, D.R., C.W. Avery, D.R. Easterling, K.E. Kunkel, K.L.M. Lewis, T.K. Maycock, and B.C. Stewart (eds.)]. U.S. Global Change Research Program, Washington, DC, USA, pp. 669–742. doi: 10.7930/NCA4.2018.CH18

