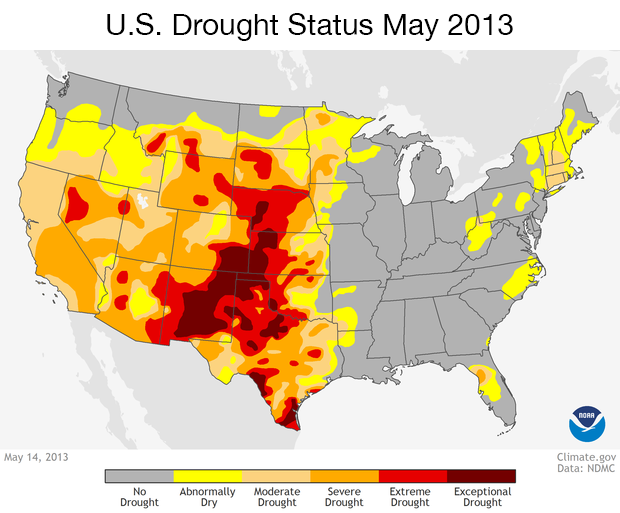
This map shows drought status across the contiguous United States on May 14, 2013. Colors on the map indicate areas that are abnormally dry (light yellow) or experiencing some level of drought. For areas in drought, the darker the color, the more severe the drought. Approximately 48 percent of the contiguous United States was in some level of drought on this date according to the U.S. Drought Monitor. An additional 14 percent was classified as abnormally dry.
Source:
Figure credit: NOAA Climate.gov.
Page/s that contain this image:
Last modified:
25 October 2019 - 4:48pm

