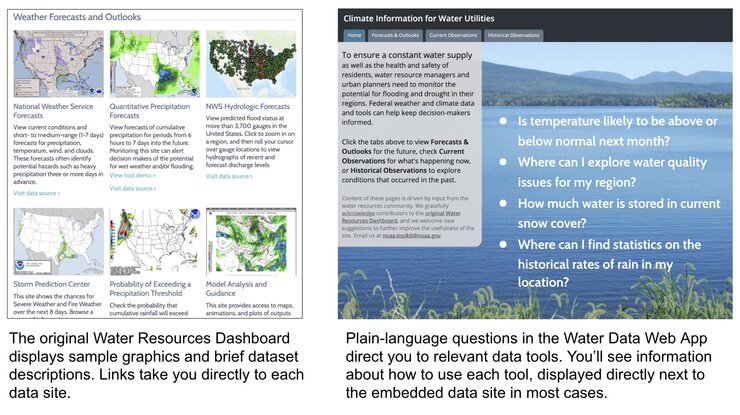
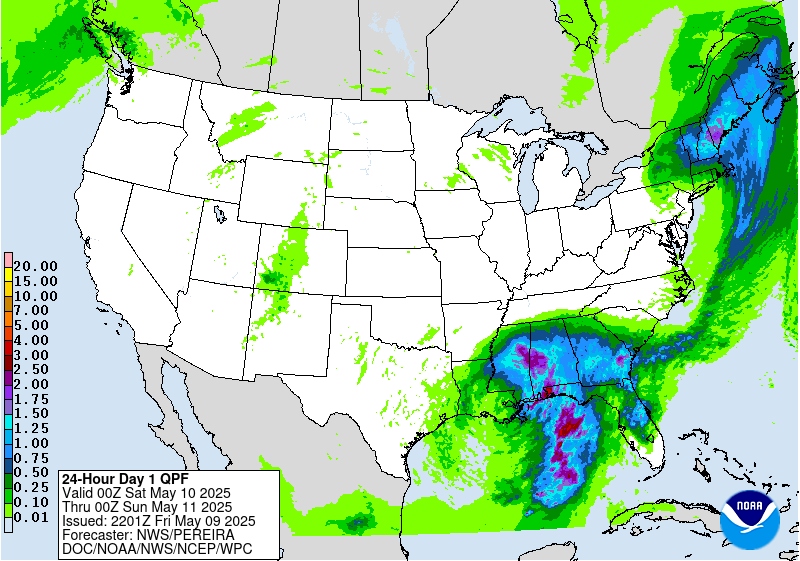
View forecasts of cumulative precipitation for periods from 6 hours to 7 days into the future. Monitoring this site can alert decision makers of the potential for wet weather and/or flooding.
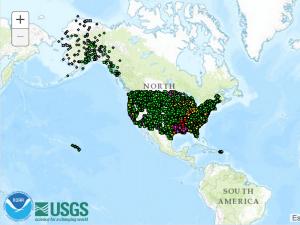
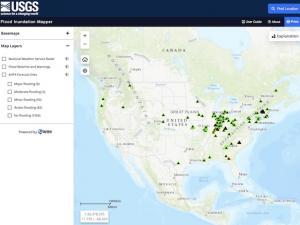
View predicted flood status at more than 3,700 gauges in the United States. Click to zoom in on a region, and then roll your cursor over gauge locations to view hydrographs of recent and forecast discharge levels
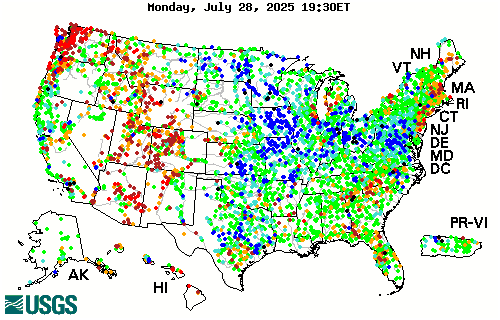
View observed flow conditions across 13 regions of the contiguous United States. For each gauge location, access hydrographs showing observed and predicted water levels that account for upcoming weather and snowmelt.
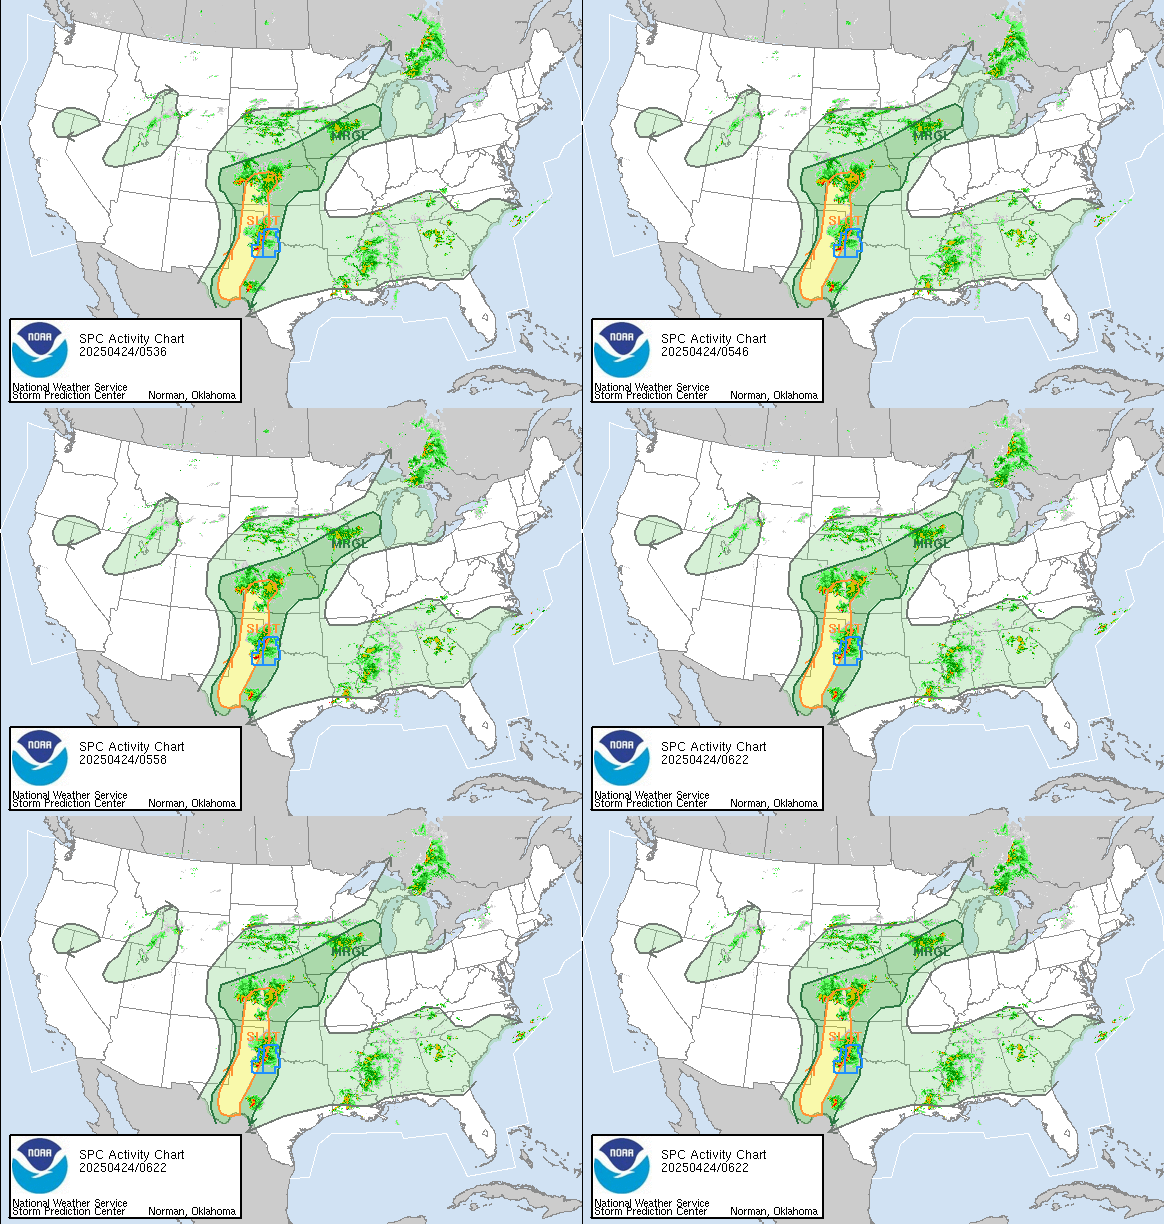
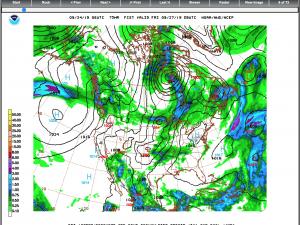
This site provides access to maps, animations, and plots of outputs from observational data and weather prediction models. The graphic products can be useful for monitoring development of potential storms.
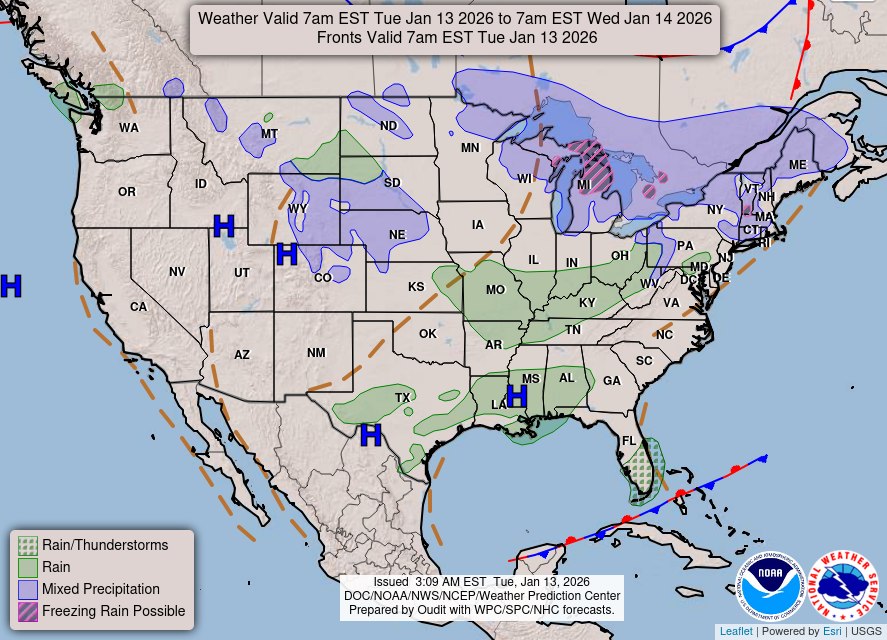
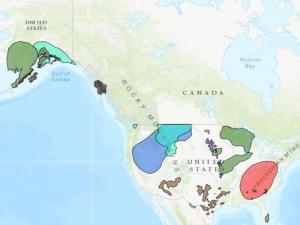
Monday through Friday, NOAA's Weather Prediction Center produces maps of hazards forecast for the next 3-7 days.
Every weekday, the Climate Prediction Center releases the U.S. Hazards Outlook highlighting potential hazardous conditions related to temperature, precipitation, and winds for days 8-14 into the future.
View monthly maps showing the probability for precipitation ranking in the top, middle, or bottom third of historical observations. Outlooks that favor drier or wetter periods can raise awareness of the potential for changing conditions.
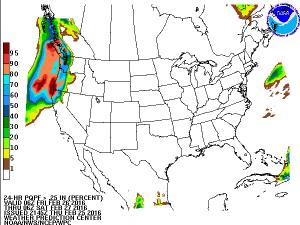
Check the probability that cumulative rainfall will exceed user-defined thresholds within the next three days over 6- to 24-hour intervals. This forecast can serve as an early alert for potential flooding related to heavy precipitation.
Maps show how conditions related to drought are likely to change over the valid period. Outlooks indicate areas where drought is likely to develop, persist (or worsen), improve, or end.
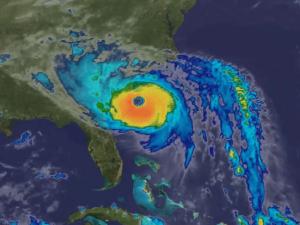
The National Hurricane Center monitors marine weather and indicates the chance that disturbances will develop into tropical storms. For storms that do develop, the site shows predicted paths and storm status. Monitor this site to be aware of the potential for tropical storms and/or hurricanes.
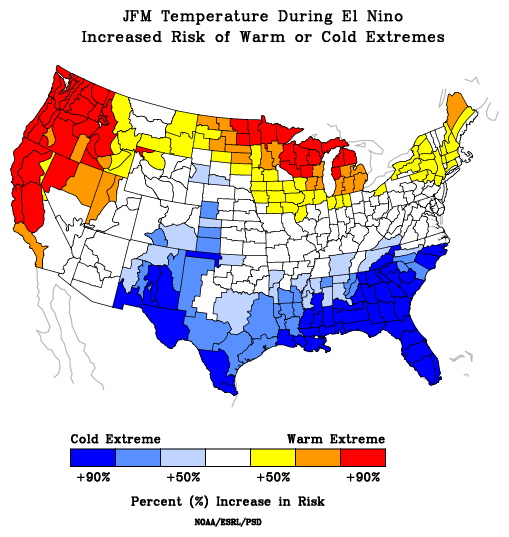
This interactive map shows regions where the risk of having a seasonal extreme in temperature or precipitation is elevated during El Niño or La Niña conditions. Decision makers can identify areas that have an increased or decreased risk of extreme warm/cold (or dry/wet) seasons, and plan accordingly.
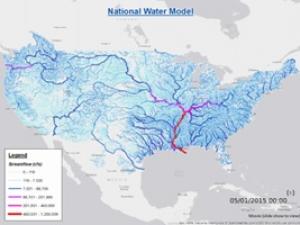
The National Water Model (NWM) forecasts streamflow for the contiguous United States. The system models processes such as snowmelt and infiltration to determine how much precipitation forecast by NWS will become runoff, and then simulates discharge levels.

