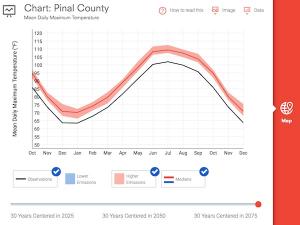
Enter a city, county, or zip code of interest. Under Mean Daily Maximum Temperature, click Monthly. Interact with the graph by adjusting the time slider.
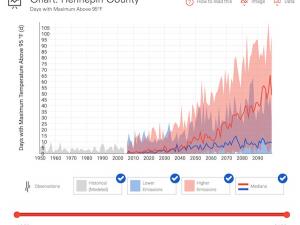
Enter a city or county of interest. Under Temperature, select Days with Maximum Above 95°F. View the graph or map for available decades by adjusting the time slider.
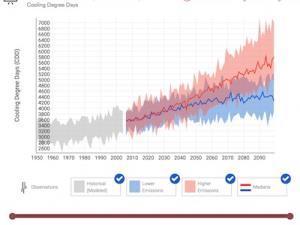
Enter a city or county of interest. Under Other, select Cooling Degree Days. Adjust the time slider on the graph or map to view by decade.
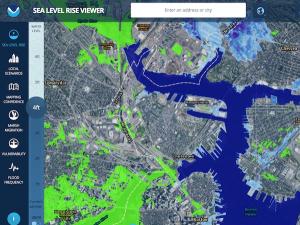
Visualize community-level impacts from coastal flooding or sea level rise, including simulations of how future flooding might impact local landmarks. Access data related to water depth, flood frequency, and mapping confidence.
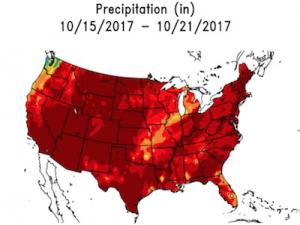
Enter a city or county of interest. Under Precipitation, select Days with Precipitation Above 1 inch. Adjust the time slider on the graph or map to view by decade.

