Image
Tool
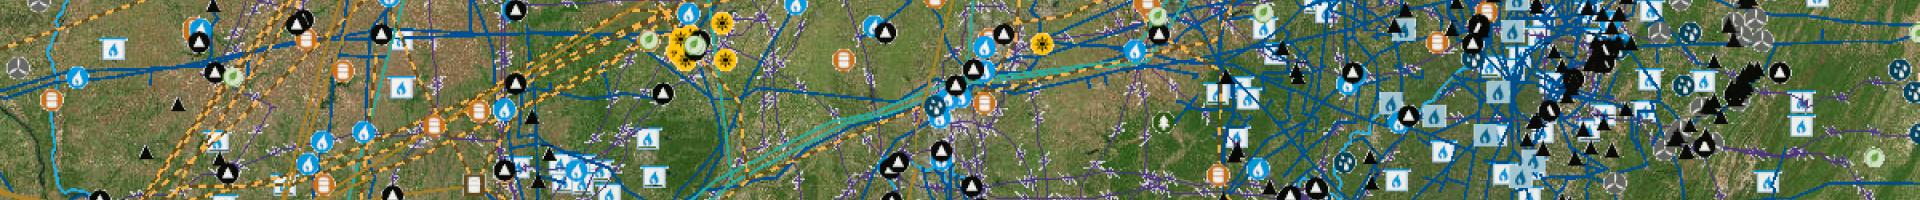
U.S. Energy Atlas - Energy Infrastructure & Resources
Explore maps of energy resources, infrastructure, and transportation networks, or view profiles of energy production and consumption, for states and territories.
The site offers map layers for fossil fuel, geothermal, biomass, solar, and wind resources. Map layers also show coal mines, power plants, oil and gas refining and processing plants, market hubs, pipelines, and electrical transmission networks.
Profiles for each state and territory provide graphs on the sources and uses of the region's energy, as well as energy prices compared to the national average. Each profile also offers a summary of household energy use, quick facts, and additional resources about energy in the selected state or territory.
Details
Hazards