Sections
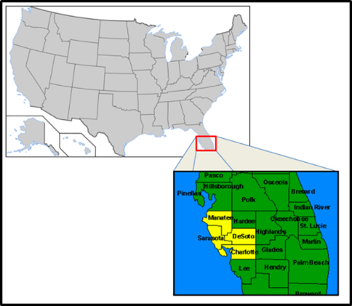
The Peace River System is a tidally influenced river that supplies water to the Peace River Manasota Regional Supply Authority, which comprises four counties in Southwest Florida.
NEED SOURCE
- The Peace River Manasota Regional Water Supply Authority has a 51 million GPD (gallons per day) treatment capacity.
- The watershed is roughly 1300 square miles, and the Peace River is the only source of water.
- The Peace River Facility is just outside of Charlotte Harbor, where it is ideally located to take advantage of water quantity and quality. The river intake is located at sea level with no dam or salinity barrier to stop upstream migration of brackish water.
At the point of intake, the daily tidal range is two feet. They are permitted to take in about 258 million GPD (gallons per day.)
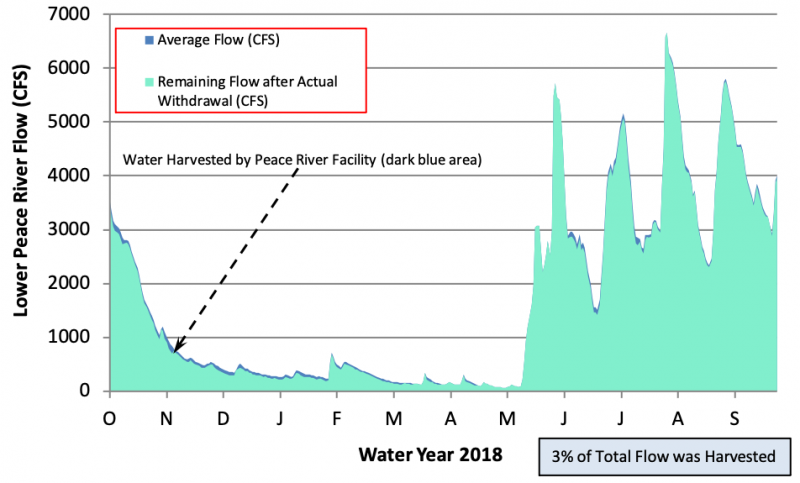
The timing and quantity of withdrawal are based on 2010 Minimum Flow & Levels. Diversions are tied to upstream flow. The goal is to mimic the natural flow of the river, thus the harvest average has been only three percent of total flow since 2011.
NEED SOURCE
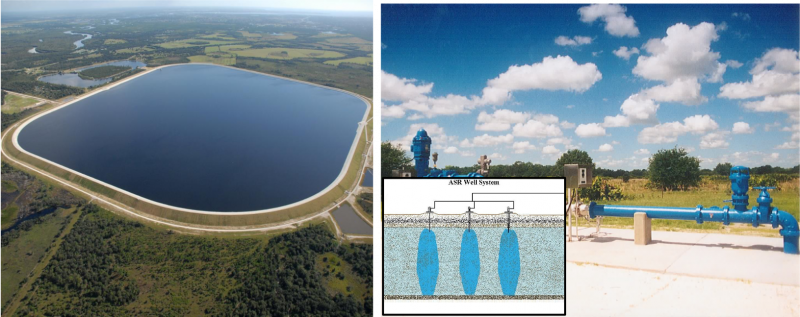
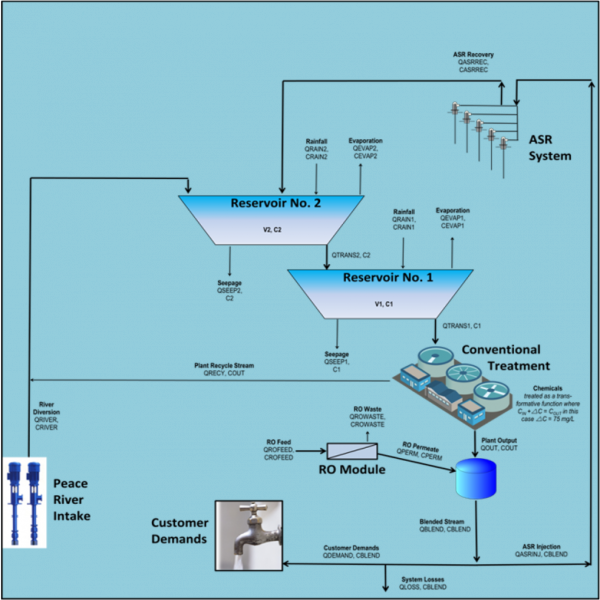
After water is withdrawn, it can be used directly, stored in two above-ground reservoirs, or stored underground in an Aquifer Storage and Recovery (ASR) system. The reservoirs contain up to 6.5 billion gallons, and the ASR wells contain up to 7 billion gallons.
NEED SOURCE
One reason that the Peace River is the sole source of water is due to the impacts of groundwater pumping. Pumping has caused groundwater depletion of over fifty feet in some areas, causing this area to become a Water Use Caution Area in 1992.
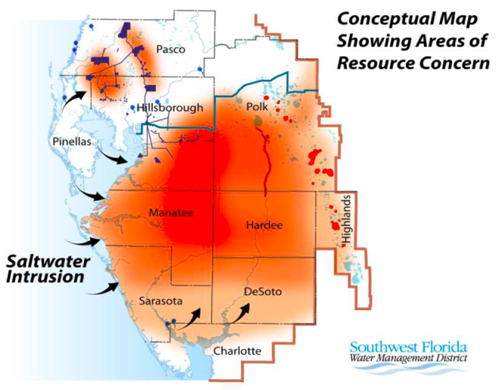
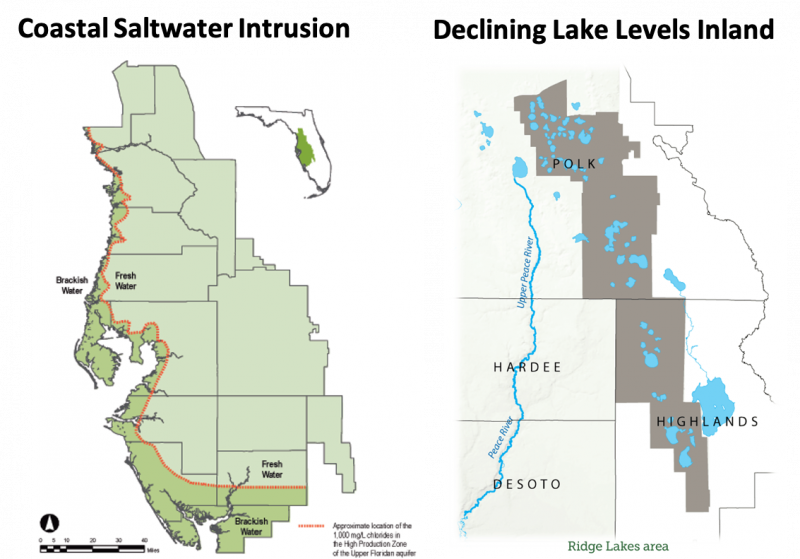
In addition to groundwater depletion, saltwater intrusion along the coasts and depleting lake levels along the Florida Ridge also pose an issue. NEED SOURCE
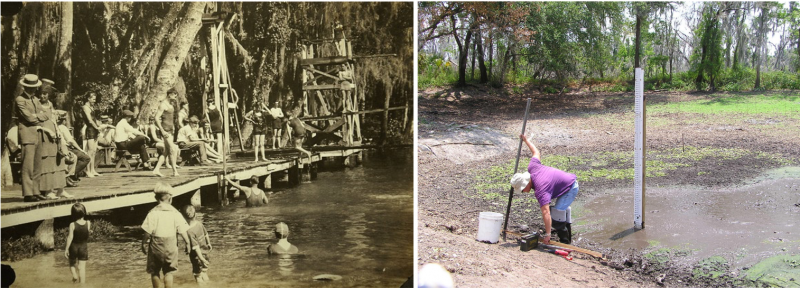
Kissingen Spring used to flow into the Peace River. Once 200 feet wide and 17 feet deep, Kissengen flowed at around 200 million gallons per day. Now the spring is nearly gone due to groundwater depletion, and it’s not certain that Kissingen will ever flow again. NEED SOURCE
"then" and "now." Even without climate change, we face severe water resource issues. Karst and limestone features hydraulically connect surface and ground waters along the Peace River. In the past, these Karst features would supplement river flow during times of drought. In addition, the upper Peace River can now go completely dry during drought.
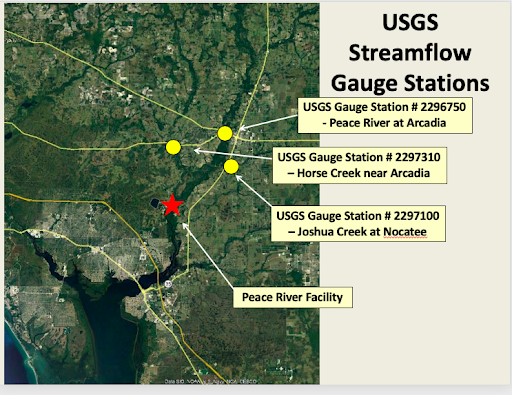
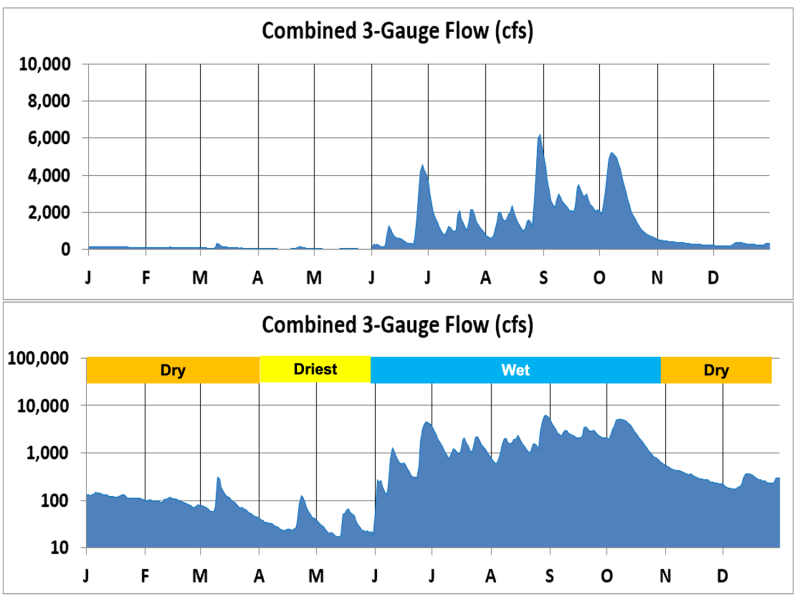
Given the location of the intake, there are potential water quality issues and saline water migrating upstream. They define their allowable withdrawals based on the combined streamflow of three gauges: the Peace River and two of its tributaries.
NEED SOURCE
The two graphs below represent streamflow in 2012. The red line represents the minimum withdrawal of 130 million gallons per day. Streamflow in the Peace is variable, and that’s visible in this graph.
NEED SOURCE
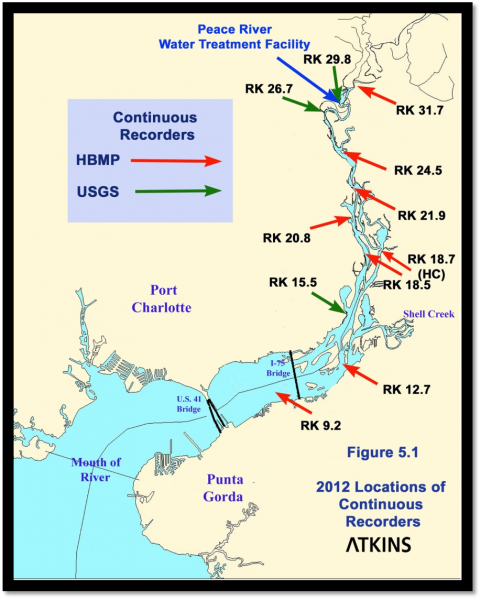
Salinity is also monitored at multiple locations along the river.
NEED SOURCE
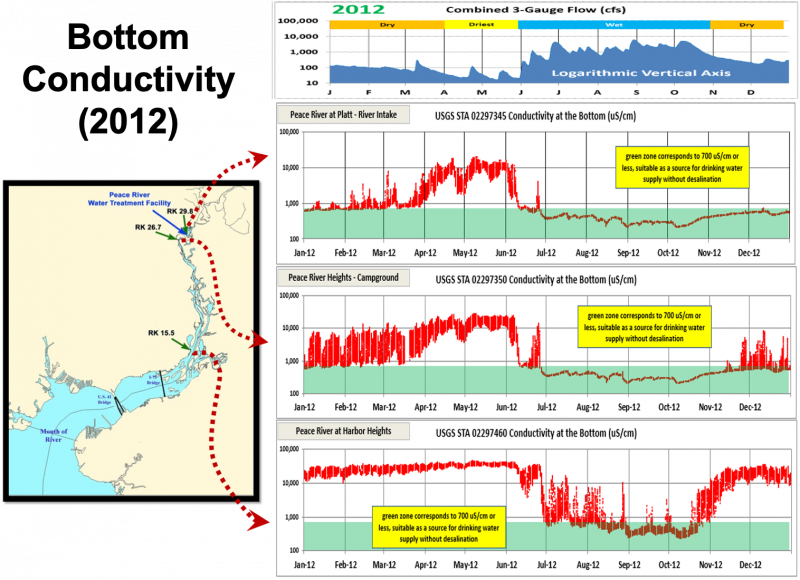
The next figure represents conductivity at three locations. Note that conductivity mimics flow. Salinity increases during low flow, increasing conductivity and vice versa. The green area represents drinking water standards: when the conductivity is above the green area, the water requires treatment. At higher conductivity levels, desalination is necessary in order to meet the drinking water standard. Since we’re not outfitted for desalination, we don’t withdraw water during those time periods. Instead, we draw on the Aquifer Storage and Recovery systems.
NEED SOURCE
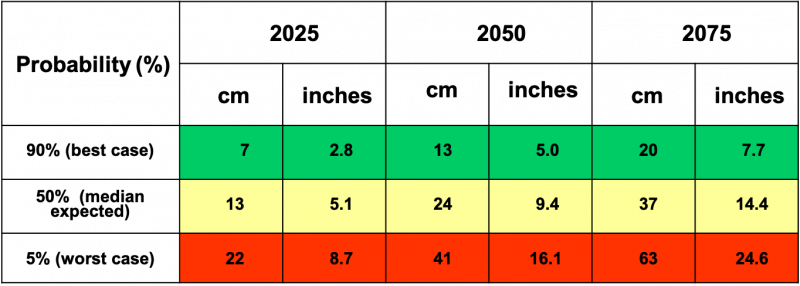
In terms of sea-level rise, there are several different scenarios. For this work, five scenarios were selected and models developed to project a range of possible flow-dependent salinity relationships for the future.
NEED SOURCE
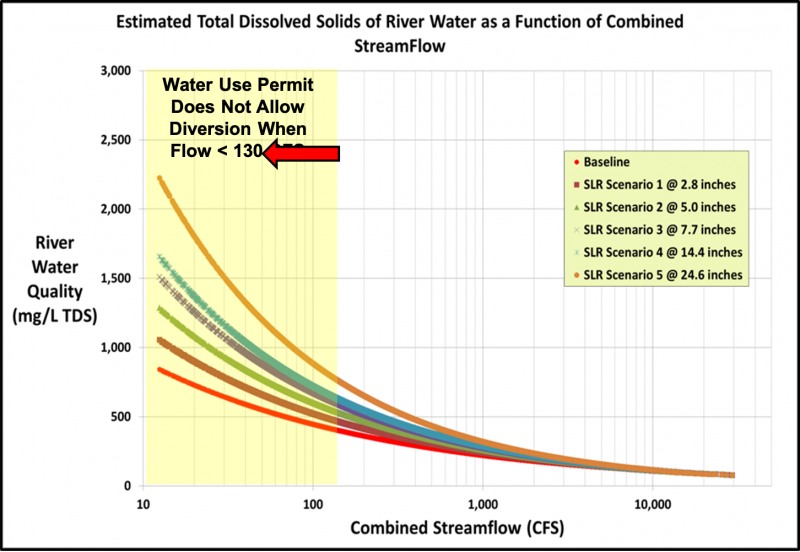
The figure below takes the five scenarios shown in Figure and depicts the relationship between total dissolved solids and streamflow. The water use permit doesn’t allow diversion when flow is less than 130 CFS.
NEED SOURCE
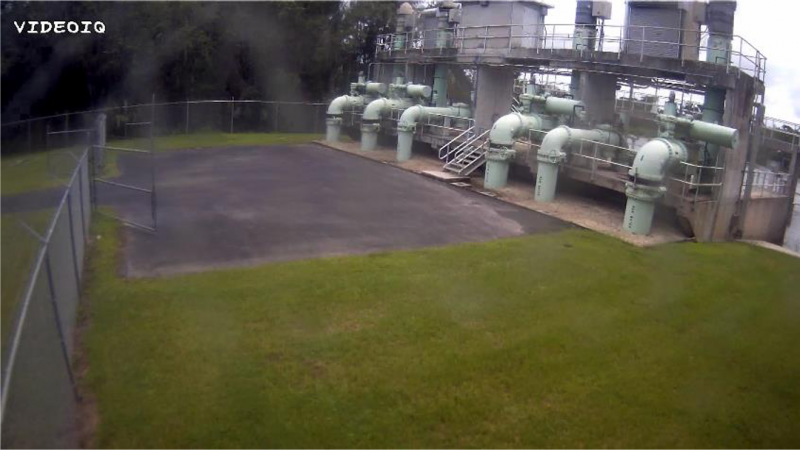
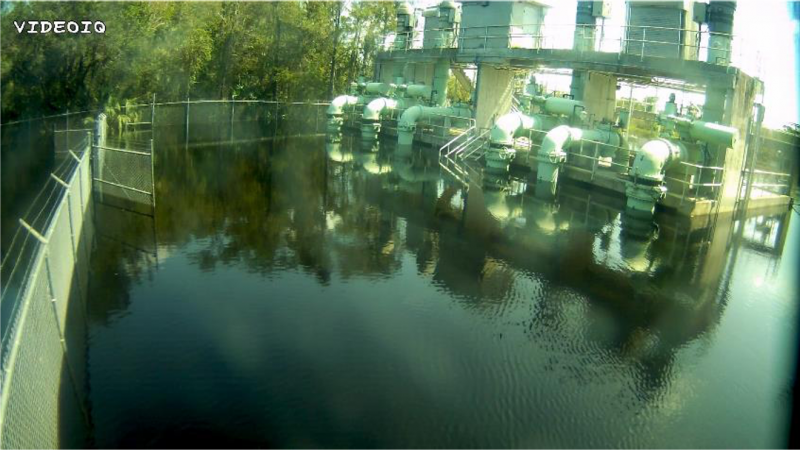
Florida is vulnerable to tropical storms and flooding. For example, the state was hit quite hard by Hurricane Irma in 2017. The two pictures below were taken just six days apart, when the Peace River rose as a result of Irma and flooded the pump station.
NEED SOURCE
NEED SOURCE
NEEDS SOURCE
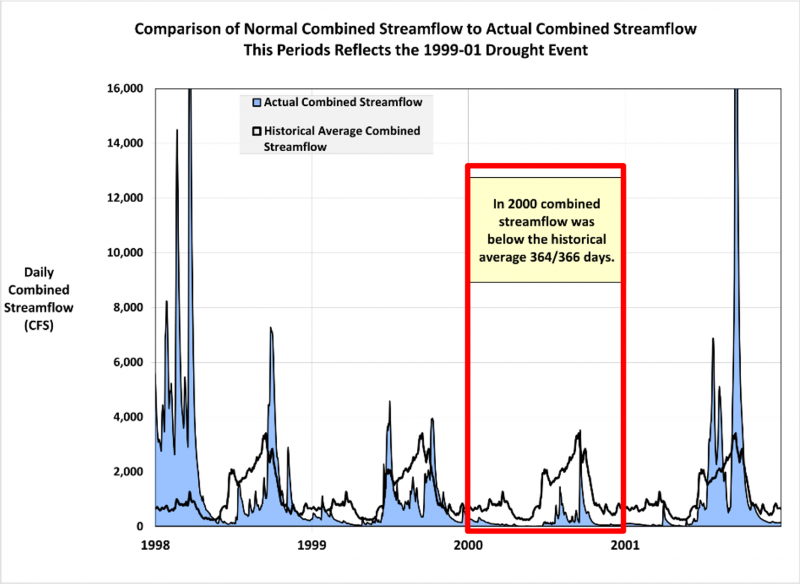
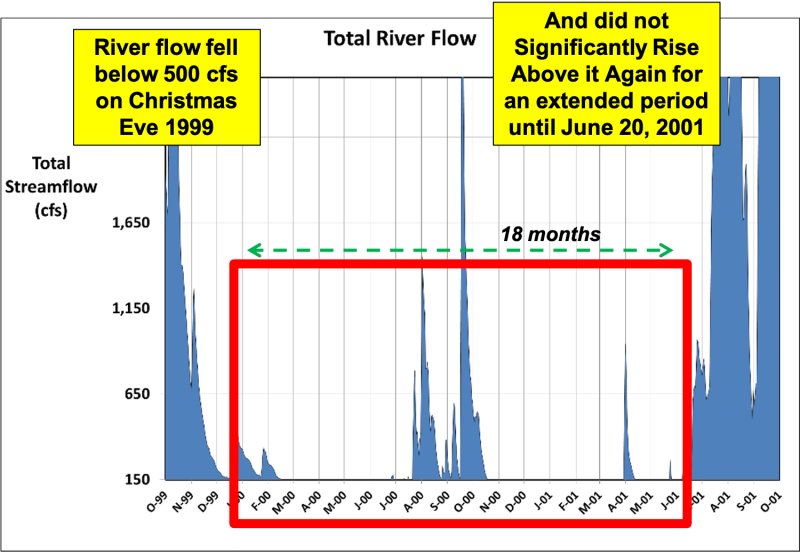
The drought of 2000-2001 is considered a “challenge event”. River flow fell below 500 CFS on December 24th, 1999 and didn’t rise and did not significantly rise above 500 CFS for an extended period until June 20, 2001. The goal is to be able to handle another event like this now and in the future.
NEED SOURCE
During the wet season, they fill the reservoir and store excess water underground. Since ASR water has higher dissolved solids content, it must be mixed with the reservoir water. Timing is important because there has to be enough surface water to dilute the ASR water, but pulling ASR water too early is more expensive since it will be treated twice. System reliability modeling starts by defining fundamental solvent and solute mass balance relationships. Solute in this case is TDS.
NEED SOURCE?
We’re building a model to account for that dissolved solid issue and understand the effects of potential sea level rise in terms of salinity levels at their intake. The system model details: Excel-based, daily time step model More than 170 variables Neural Net: a complex web of nested IF/THEN statements embedding logic to simulate decision making Operational Constructs: Activation Trigger Points Ramp Up Schedules Rotational Management Philosophy 41 Years of streamflow (1975-2015) for 3 stream gauges. Success is measured with a System Reliability Measure over the 41 year model study period.
NEED SOURCE
