The latest version of the Climate Explorer offers climate projections for every county in the entire United States. The recent addition of climate projection data for Hawai'i and U.S. island territories in the Pacific Ocean and Caribbean Sea complements the tool’s original contiguous U.S (CONUS) coverage and the addition of data for Alaska.
Launch the Climate Explorer Tool
Optionally, launch an introductory version of the tool, Getting a feel for your climate future
Features of the tool help users read the graphs and maps to understand conditions projected for future decades.
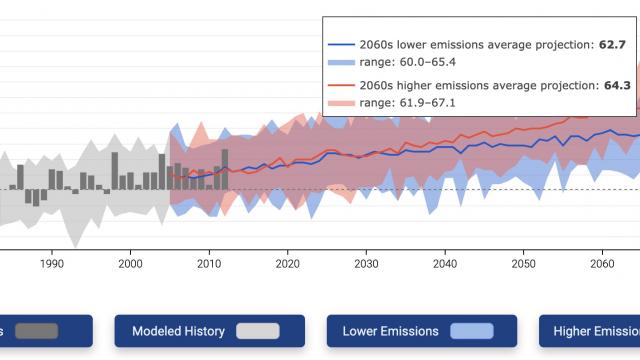
- Graphs in the tool feature dynamic display of values under the user’s cursor. To encourage appropriate use of data, the tool displays decadal averages of projections rather than annual values.
- The map interface lets users make visual comparisons of past and projected conditions for two scenarios. Click any county in the maps to see summary statistics for color-coded variables shown on the maps.
View content under the “How to read” button on graphs to understand and interpret the various graph elements for the contiguous U.S., Alaska, and Hawai’i & U.S. territories.