Tsunami
A tsunami is a series of ocean waves produced by sudden movements of the ocean floor—tsunamis can be caused by earthquakes, landslides, or volcanic activity. In the deep ocean, tsunami waves can travel across the ocean as fast as a commercial jetliner (more than 500 miles per hour), yet appear to be a simple ripple only a few inches high at the ocean's surface—likely not noticeable to someone on a boat or ship. For more information on how tsunamis form and travel across the ocean, including animated graphics, visit the NOAA Tsunami website.
As tsunami waves approach shore, they begin to slow down and build in height. The shape of the waves is changed by the depth of the water and the slope of the coast.
To someone standing on the shore watching a tsunami approach (not recommended!), it might look like a fast-moving (20–30 mph) wall of water 10 feet high or more. Large tsunamis are rare, but when they occur, they carry great destructive potential and pose a serious threat to coastal communities in their path.
The U.S. Tsunami Warning System provides real-time information on tsunami watches, warnings, or advisories at tsunami.gov.
If you are in Hawai'i or Guam, you can find information in the TSUNAMI AWARE tool.
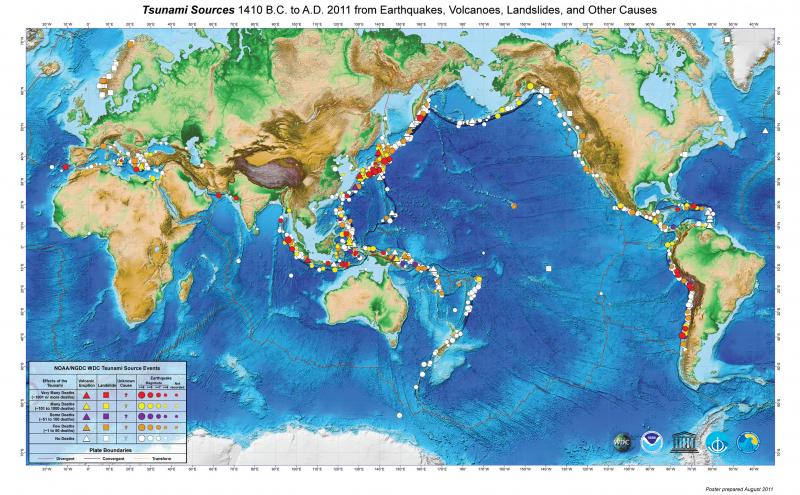
Tsunamis have no “season,” and can strike at any time of day or night, in good weather or bad. They occur in every ocean and sea, but most tsunamis (about 85 percent) happen in the Pacific Ocean. Tsunamis cannot be prevented; however, their impacts on coastal communities can be mitigated through planning, preparedness, timely warnings, and effective response. Keep in mind: any tsunami today happens on top of the 8-inch rise in average global sea level since 1900. According to projections, by the year 2100, tsunamis will happen on top of another 1 to 8 feet of sea level rise.1
This table provides a qualitative tsunami hazard assessment for U.S. states and territories:2
| Region | Hazard Based on Runups | Hazard Based on Frequency | Hazard Based on Local Earthquakes | Number of Reported Deaths Since 1900 |
|---|---|---|---|---|
| Hawai'i | Very High | Very High | High | 326 |
| Alaska | Very High | Very High | High | 222 |
| Puerto Rico and the Virgin Islands | High | High | High | 172 |
| U.S. West Coast | High | High | High | 25 |
| U.S. Pacific Island Territories | Moderate | High | High | 1 |
| U.S. Atlantic Coast | Very Low to Low | Very Low | Very Low to Low | None |
| U.S. Gulf Coast | Very Low | Very Low | Very Low | None |
- 1Sweet, W.V., R.E. Kopp, C.P. Weaver, J. Obeysekera, R.M. Horton, E.R. Thieler, and C. Zervas, 2017: Global and Regional Sea Level Rise Scenarios for the United States. NOAA Technical Report NOS CO-OPS 083. NOAA/NOS Center for Operational Oceanographic Products and Services. 75 pp.
- 2Dunbar, P.K., and C.S. Weaver, 2008: U.S. States and Territories National Tsunami Hazard Assessment: Historical Record and Sources for Waves. National Tsunami Hazard Mitigation Program, 59 pp.


