Online Training for Water Utilities | WUCA
This training course for water utility managers and consultants, developed by the Water Utility Climate Alliance (WUCA), covers methods for including climate science in water supply planning processes.

Decision Framework for Infrastructure Sequencing at Tampa Bay Water

The video is a recorded presentation delivered in May 2019 as part of a two-day technical training course held by the Water Utility Climate Alliance (WUCA) in Tampa, Florida. The course was attended by drinking water and wastewater utility managers and consultants from across the United States.

Watch the whole video, or browse the content by section below. Click any section title to jump directly to that content in the video. All slide images were provided by the presenter.

Instructor
Tirusew Asefa, Tampa Bay Water
20:00 minutes

Introduction

Developing a Master Plan for a water utility is crucial to ensuring supply will meet future demand. Join Tirusew Asefa as he shares how Tampa Bay Water used their Master Plan to develop a decision framework for infrastructure sequencing to indicate at what point regional demand will require use of the next supply source.

Key Points:

  • Meeting future water needs requires more than new supply sources.
  • Prudent water supply planning requires evaluation of many possible future conditions and management options.
  • Understanding and monitoring uncertainties are both essential to plan success.
  • Plan for multiple futures.
Background on Tampa Bay Water
0:00:57
0:01:57
(1 minute)

Tampa Bay Water provides water to six member governments, three cities and three counties, with a regional demand of 200 to 250 MGD (million gallons per day). The utility uses an integrated drought-resistant supply system composed of:

  • 13 wellfields 
  • 8 groundwater treatment facilities 
  • Surface water treatment plant 
  • Desalination treatment plant 
  • 9 pump stations 
  • 270 miles of transmission mains.
Planning for 2040
0:01:58
0:07:35
(5.5 minutes)

The overarching question is how much water may the Tampa Bay region need by 2040?

It would be easy to answer this question if water supply and demand were known, fixed amounts. The truth is supply and demand aren’t fixed; they change due to weather, population, socioeconomics, and more. Planning for the future involves looking at historical records to anticipate supply and demand.

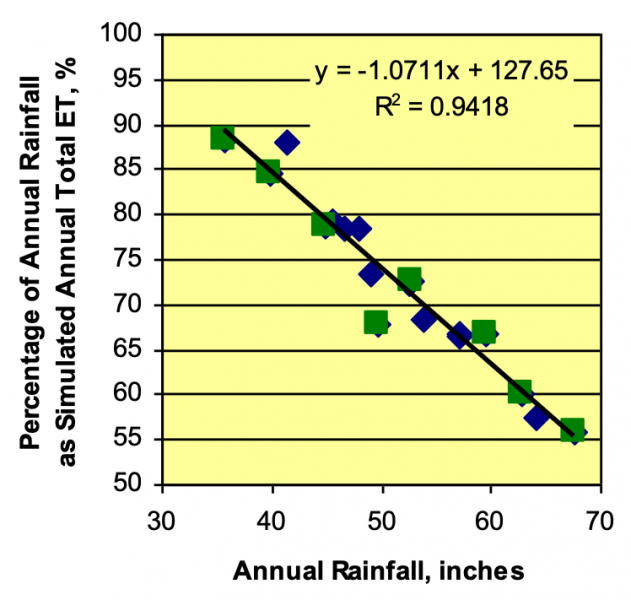
Let's begin with a look at annual rainfall and evapotranspiration rates here in the Tampa Bay area (see figure below).

Rainfall vs Evapotranspiration in Tampa Bay

Percent of annual rainfall that ends up as evapotranspiration as a function of annual rainfall.

Note that between 55% and 90% of the rain returns to the atmosphere as evapotranspiration rather than running off as surface water, with evapotranspiration declining as rainfall increases. This rate of evapotranspiration affects surface water amounts. How will a changing climate affect rainfall rate, evapotranspiration and resulting supplies of surface water?

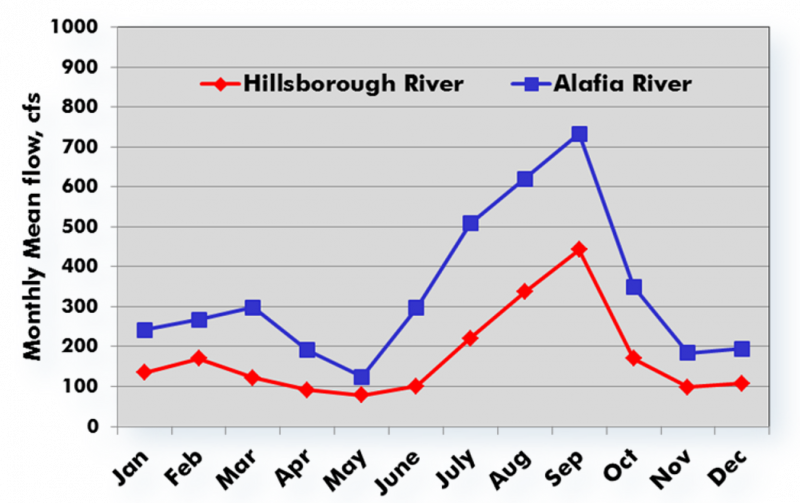
Now, let's look at the annual surface water availability in the Tampa Bay Water area (see figure below).

Tampa Bay Water Surface Water Availability

The annual surface water availability in the Tampa Bay Water region.

Rainfall, and consequently surface water availability, varies seasonally. Rainfall and river runoff are greatest in the four months around summer and early fall. Tampa Bay Water stores surface water from the Hillsborough and Alafia Rivers to meet demand year-round.

Rainfall also varies annually as exemplified in 2017 when a drier-than-average winter and spring led into a winter with greater-than-average rainfall plus a hurricane. The overall annual actual rainfall, however, was below the average.

Demand is driven by socioeconomic parameters, including population growth, income, and price. Climate impacts the demand, and there are strategies for both passive and active demand management. Key uncertainties to consider when planning for water supply in the future include how climate will impact supply sources, level of service, regulatory requirements, finance, and sustainability.

Long-Term Demand Forecasting
0:07:36
0:10:37
(3 minutes)

"Forecasting is the art of saying what will happen, and then explaining it why it didn’t.” – Anonymous

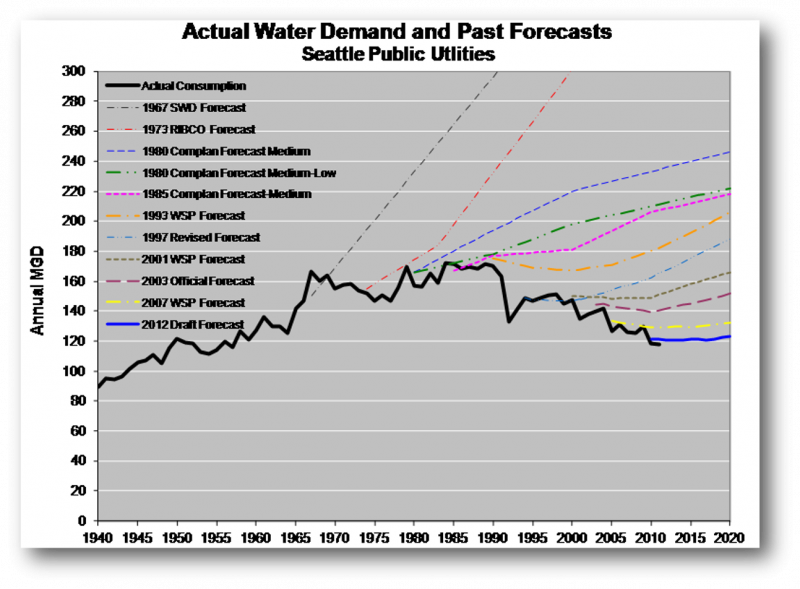
Before evaluating supply, we predict demand. As the graph below reinforces, forecasting demand is challenging and rarely accurate.

Forecast and actual water demand in Seattle, WA

Forecasts made between 1967 and 2012 and the actual water demand (black solid line).

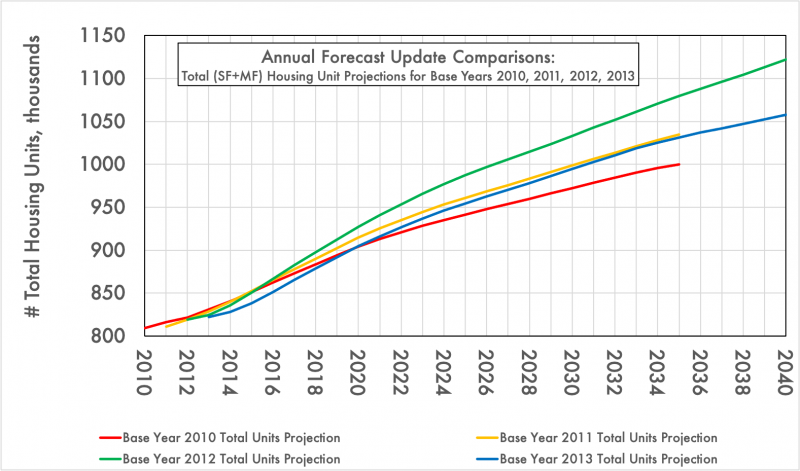
The graph below demonstrates the challenges in predicting how many housing units to provide for. Note that each year forecasts a different number, often on the order of tens of thousands of units. For every 50,000 additional housing units, roughly 11 MGD would be required and 10 MGD requires $150M to $250M in capital investment. (A Hot-Dry climate scenario would shift demand upward by almost 20 MGD.) The ability to forecast accurately becomes a matter of supply as well as economy.

Predicting housing units over time

Range of variability in housing units based on the baseline year for each projection.

Identifying the Next Supply Source
0:10:37
0:12:13
(2 minutes)

Once future demand requirements are established, Tampa Bay Water considers supply sources.

  • Identify options such as expanding surface water treatment plants or expanding our desalination capacity.
  • Stress test to see if a given project concept is worth further investigation. Conduct a full Monte Carlo simulation (334 demand-supply pairs.)

Each full run took about 5 to 6 hours on a cluster of computers. Over a hundred project concepts were evaluated using the level of service criteria to meet demand. We grouped the potential scenarios and narrowed it to three surface water project concepts:

  • Surface water treatment plant expansion with existing source water 
  • Desalination facility expansion with existing source water 
  • New groundwater treatment plant via net benefit from SHARP program.
Master Water Plan Update Cycle
0:12:14
0:18:22
(6 minutes)

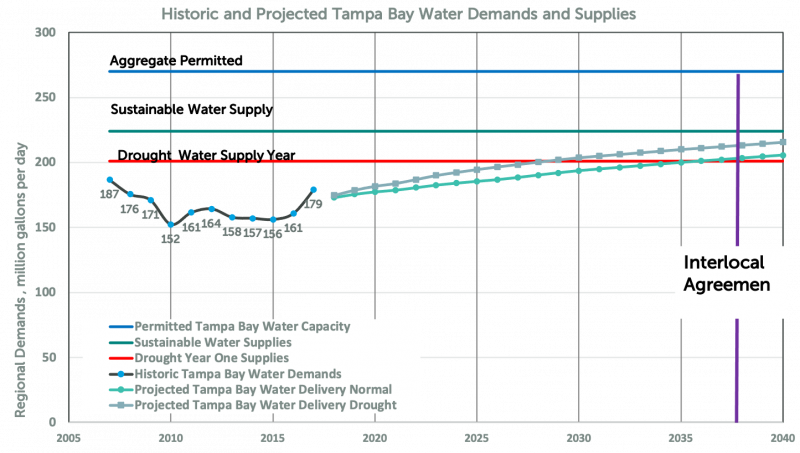
Consider the graph below:

Tampa Bay Water Master Plan Planning Graph

The year the new Master Water Plan would need to be initiated.

Based on projected water delivery requirements, our water plan would need to shift by 2028.

It is important to look at a wide range of supply, demand, and operations possibilities before planning or building infrastructure. Also, define system-level metrics. For example, how frequently might there be a water shortage? Depending on the supply and demand, there should be a time frame associated with any given scenario.

Once expected future conditions are agreed upon, policy makers evaluate how much risk they can tolerate before a new supply will be required.

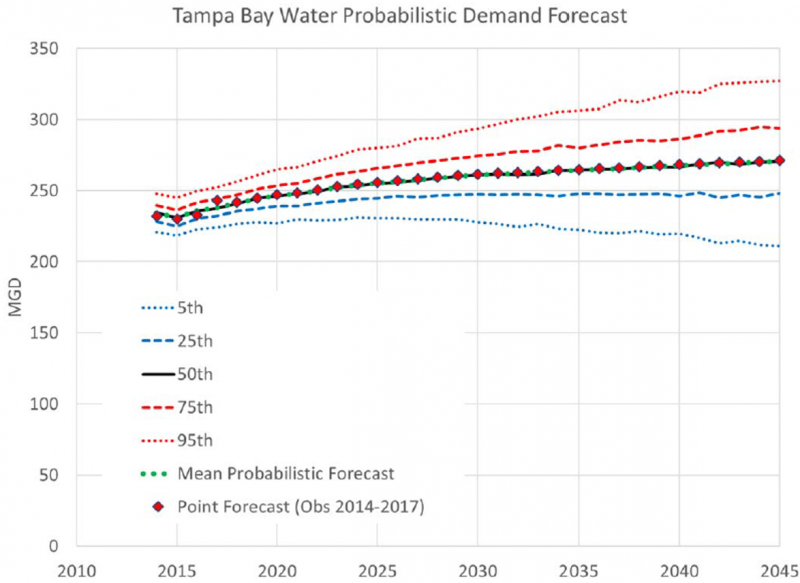
Now consider the graph below showing the range of projected demand on Tampa Bay Water:

Tampa Bay Water Demand Forecast

Range of demand projections Tampa Bay Water can expect between 2014 and 2045.

The question to be asked, and answered from this data is this: How much risk can be tolerated before new supply is required?

Residual Risk Management (Water Shortage Mitigation Plan)
0:18:23
0:19:12
(1 minute)

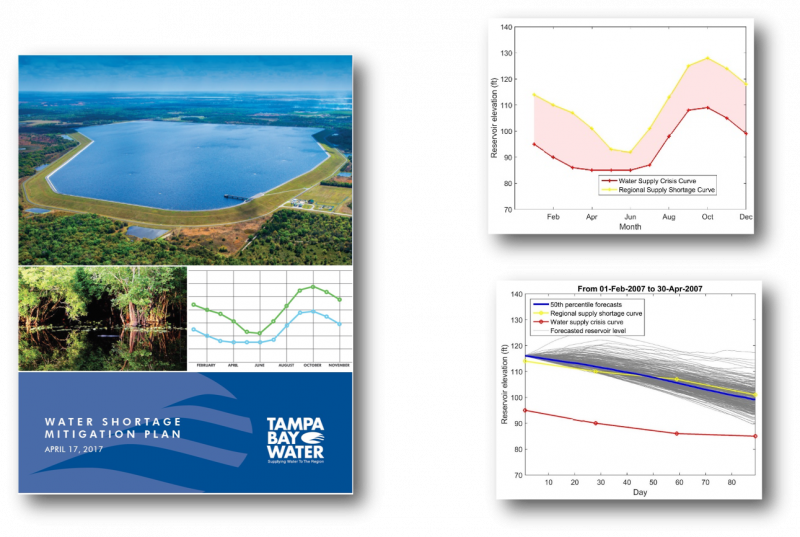
Residual Risk Management was evaluated based on future demand using a water shortage mitigation plan, which includes supply and demand management, forecasting, using climate information to inform the public, and different scenarios in different phases, etc. While each of these was explicitly modeled, there is a lot of uncertainty inherent to understanding hydrology, hydrological cycles, and socioeconomic factors.
Tampa Bay Water Mitigation Plan

Tampa Bay Water Mitigation Plan.

Online Training for Water Utilities | WUCA

Chapter 1: Introduction
Unpredictable rainfall, stronger storms, and changes in historic weather patterns are just some of the observed effects of climate change. You can’t afford to be unprepared for emerging conditions and, on the other hand, you can’t be prepared for everything—and it’s not financially feasible to prepare for the worst-case scenario. Developing a plan to assess the vulnerability of your utility is essential for building resilience and ensuring you, and your customers, are prepared for a changing future. This short module provides an overview to get you started on the right foot.
Instructor
Laurna Kaatz
4 Sections
12:10 Minutes
Developing a plan to assess the vulnerability of your utility is essential for building resilience and ensuring that you, and your customers, are prepared for a changing future. This module provides an overview to get you started on the right foot.
Chapter 2: Understand
You are ready to begin assessing the vulnerability of your water utility. The first steps involve an understanding of climate science, a look at projected future climate scenarios, and an overview of how climate data is collected and applied to your specific project. With these tools in your toolkit, you can move on, with confidence, to planning your assessment.
Instructor
Joel Smith
9 Sections
50:53 Minutes
This course module reviews observed and projected climate change as well as many sources of uncertainty, particularly focusing on the southeastern United States.
Instructor
Julie Vano, Ph.D
8 Sections
27:26 minutes
Global climate models represent climate data at a high resolution. Downscaling produces accurate global climate data at a resolution useful on a local scale.
Chapter 3: Plan
How do we make decisions in light of uncertainties, especially when those decisions will last a long time? The next two lessons will show you how to move into the future with confidence.
Instructor
Rob Lempert, PhD; & Michelle Miro, PhD
7 Sections
47:00 minutes
This course module reviews observed and projected climate change as well as many sources of uncertainty, particularly focusing on the southeastern United States.
Chapter 4: Implement
Instructor
Wendy Graham, Ph.D.
6 Sections
27:30
Once you plan the work, it's time to work the plan! The two lessons in this chapter show real-life examples of implementation in southwest Florida.
Instructor
Chris Martinez, Ph.D, and Kevin Morris
8 Sections
16:20
This course module reviews observed and projected climate change as well as many sources of uncertainty, particularly focusing on the southeastern United States.
Chapter 5: Case Studies
Instructor
Tirusew Asefa, Tampa Bay Water
7 Sections
20:00 minutes
This course module reviews observed and projected climate change as well as many sources of uncertainty, particularly focusing on the southeastern United States.
Instructor
Ana Carolina Coelho Maran, Ph.D., P.E.
5 Sections
24:30 minutes
This course module reviews observed and projected climate change as well as many sources of uncertainty, particularly focusing on the southeastern United States.
Instructor
Brandon Goshi
6 Sections
26:00 minutes
This course module reviews observed and projected climate change as well as many sources of uncertainty, particularly focusing on the southeastern United States.