Screen capture from the Climate at a Glance tool

Climate at a Glance

Generate graphs and maps of monthly temperature and precipitation values, ranks, and anomalies for the globe, contiguous U.S., states, climate divisions, and selected cities.

Climate at a Glance allows near-real-time analysis of monthly temperature and precipitation data across the contiguous United States. Users can request data for select cities, states, regions, and the nation as a whole to compare current conditions with the historical record. Data are available for the period 1895 to the present.

The tool is ideal for studies of climate variability and change. The tool’s graphing functions allow users to determine whether, and how much, a given location or area is warming or cooling; or experiencing an overall change in precipitation. Features include:

U.S. mapping interface

U.S. Mapping Interface

Climate at a Glance offers a mapping interface to display data from the U.S. Climate Divisional Database. The tool offers near real-time analysis of monthly temperature and precipitation data across the contiguous U.S. Users can show monthly or yearly Values, Ranks, or Anomalies for Temperature, Precipitation, Heating days, Cooling days, and four drought indices. These records are available for National, Regional, Statewide, or Divisional extents.

Because these data are primarily intended for the study of climate variability and change, observations have been adjusted to account for the artificial effects introduced into the climate record by factors such as instrument changes, station relocation, observer practice changes and urbanization. Some of the more current data provided by the Climate at a Glance system are preliminary and may be modified after appropriate quality control has been performed. As a result, some values available on this site differ from the official observations.

Time series graphs for contiguous U.S, regions, states, and selected cities
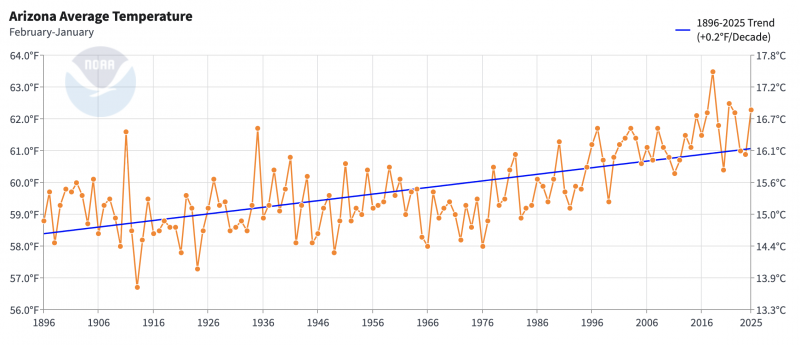
Graph Depicting U.S. Time Series from Climate at a Glance

This tool generates time series graphs of Temperature, Precipitation, Heating Degree Days, Cooling Degree Days, and four drought indices from the U.S. Climate Divisional Database. Users select spatial extents as large as the entire contiguous United States and as small as a city within it (data are available for almost 200 selected cities). Time scales range from 1 month to 60 months, and include functions such as Year to date and Previous 12 months. Users can customize the time series graphs by selecting the base period, including a trend line showing change over a decade or a century, or showing a statistically smoothed version of the data. Users can zoom and pan on the interactive graphs.

Global temperature anomalies
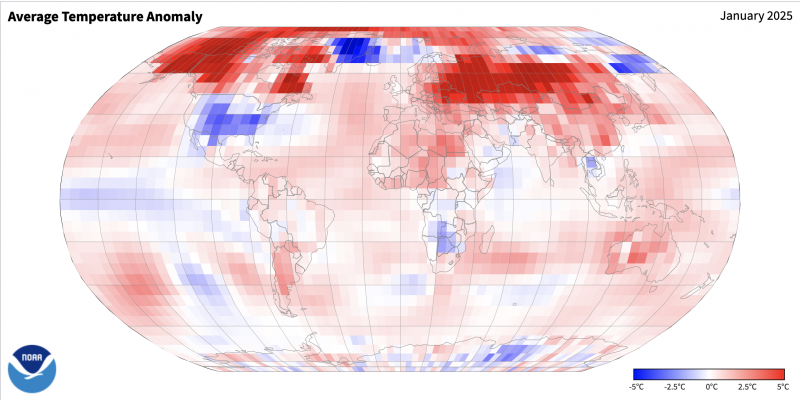
Map Showing Global Temperature Anomalies

Global-scale maps of monthly and yearly temperature anomalies show where it was warmer or cooler than the long-term average from 1981 to 2010. Clicking any grid cell on the map produces a bar graph of annual temperature anomalies for that cell from the time data collection began at that location through the present.

The mapping tool shows temperature anomalies calculated from the National Climatic Data Center's merged surface temperature product, which combines land-based temperatures from the Global Historical Climatology Network-Monthly (GHCN-M) data set with sea-surface temperatures from the Extended Reconstructed Sea Surface Temperature data set (ERSST v3b). The monthly analysis begins January 1854, but due to very sparse data, no global averages are computed before 1880.

Time series graphs for global temperature anomalies
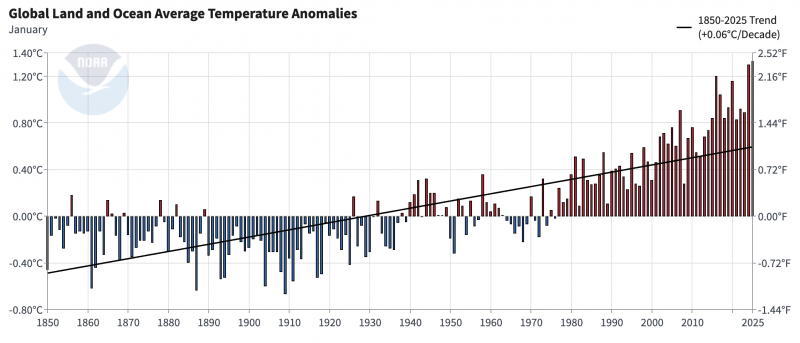
Graph Depicting Global Time Series

This tool generates time series graphs of temperature anomalies. Values are calculated from the National Climatic Data Center's merged surface temperature product, which combines land-based temperatures from the Global Historical Climatology Network-Monthly (GHCN-M) data set with sea-surface temperatures from the Extended Reconstructed Sea Surface Temperature dataset (ERSST v3b). Users select the entire globe, or the Northern or Southern Hemisphere and a time scale from 1 month to 60 months, or specific time periods such as Annual, Year to date, or Previous 12 months. The base period for calculating anomalies is 1901 to 2000. Users can overlay trend lines for any part of the record, and zoom and pan on the interactive graphs.

Last modified
10 May 2024 - 12:15pm