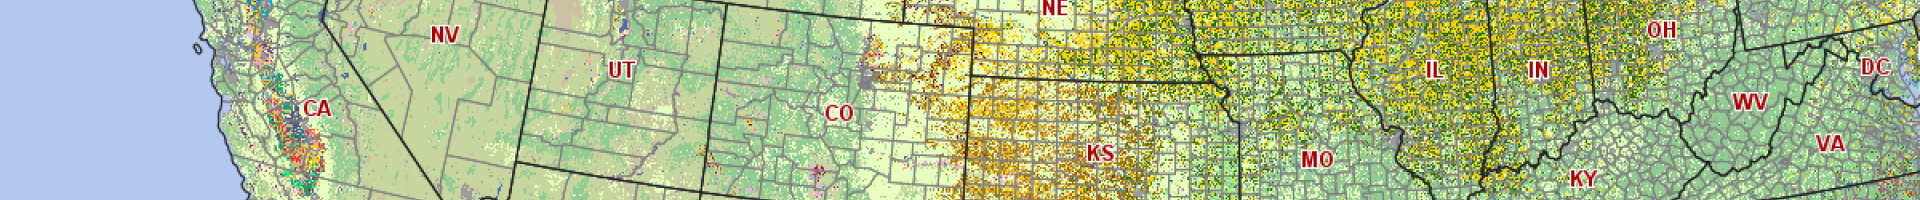
Screen capture from CropScape

CropScape

View the USDA Cropland Data Layer to check the type of crop grown in each field across the contiguous U.S. from 1997 to the present. View a sequence of regional views to see how the distribution of specific crops has shifted over time.

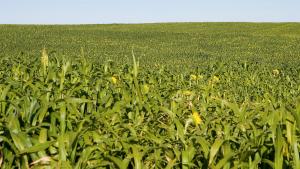
CropScape displays data from the United States Department of Agriculture (USDA) Cropland Data Layer (CDL), an annual, remote-sensing snapshot of crop cover during the main growing season across the contiguous United States. Developed within the USDA's National Agricultural Statistics Service (NASS), CropScape is a web-based interactive map visualization, dissemination, and querying system for U.S. cropland. CropScape provides crop-specific land cover data layers created annually for the continental United States using moderate resolution satellite imagery and extensive agricultural ground truthing. Decades of work digitizing field boundaries and confirming crop types led to an automated process by which a computer algorithm interprets the type of crop growing in each field from satellite data.

Within CropScape, users can find data on the type of crop planted in fields each year dating back to 1997. Viewing CropScape within an Internet browser brings the power of geographic information systems (GIS) software to desktop computers, eliminating the need for specialized software, extra computing power, and lengthy training courses. Experienced GIS users who want to download data files and perform their own analyses can do so, but these skills and assets are not necessary to use these valuable tools.

Last modified
2 August 2019 - 3:57pm