Extreme Heat
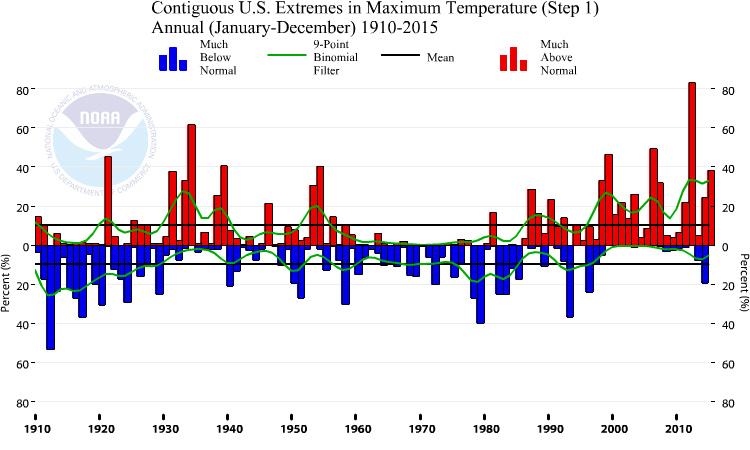
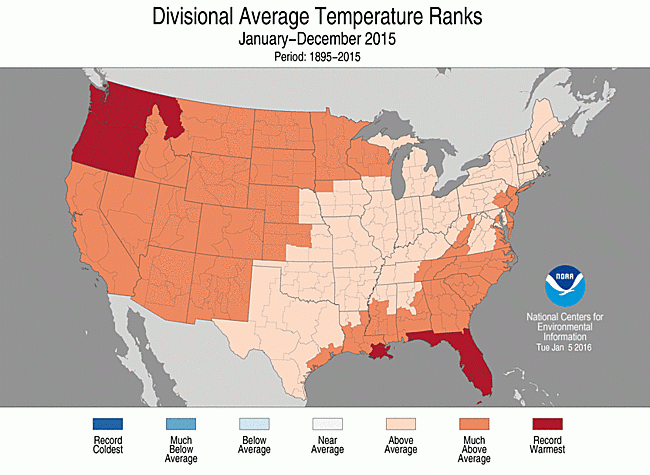
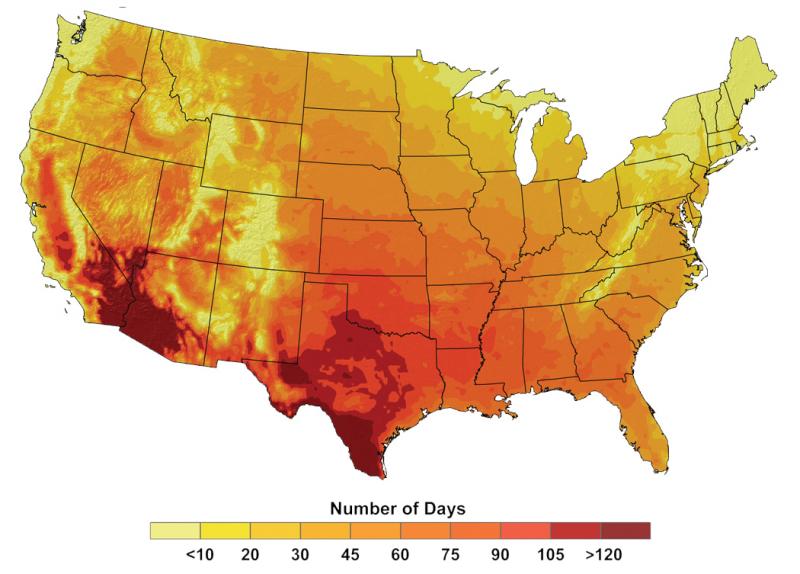
Unusually hot summer days and nights have become more common across the contiguous United States over the last few decades.1 Since the 1970s, record-setting daily high temperatures have become more common than record-setting lows across the country, with the record highs outnumbering record lows, on average, by a ratio of 2:1 from 1999 through 2009.1 Climate models predict an increase in the frequency, severity, and length of heat waves in coming decades.1
Extreme heat, whether in the form of rising long-term average temperatures or punctuated by heat waves, is a global health threat. In the United States, it is already deadlier than all other natural disasters combined, and it will clearly be exacerbated by a changing climate. In response to this growing threat, the Centers for Disease Control and Prevention, the National Oceanic and Atmospheric Administration, and domestic and international partners have created the National Integrated Heat Health Information System (NIHHIS). NIHHIS is designed to better understand health problems associated with extreme heat and determine what information is needed to address them, to develop a robust and science-informed response, and to build capacity and communication networks to improve resilience. Visit Heat.gov for heat-health resources, including current forecasts and predictions and information, case studies, reports, and tools to help reduce health risks due to extreme heat.
Extreme heat-related health effects
Extreme heat events are one of the leading weather-related causes of death in the United States—from 1999 through 2009, extreme heat exposure caused more than 7,800 deaths.2 Heat waves are especially hard on children, the elderly, outdoor workers and athletes, economically disadvantaged groups, and those already suffering from chronic illnesses, often resulting in more trips to the hospital.3
Hotter than average days in the summer increase illness and death by compromising the body’s ability to regulate its temperature. This loss of temperature control can result in a cascade of illnesses, including heat cramps, heat exhaustion, heatstroke, and hyperthermia. Even small differences from seasonal average temperatures are associated with increased illness and death. Temperature extremes can also worsen chronic conditions, including cardiovascular, respiratory, and cerebrovascular disease and diabetes-related conditions.3
In cities, the “urban heat island” effect can increase temperatures from 1.8 to 5.4°F higher than the less developed areas around them.4 An increase in warmer nighttime temperatures means that many people are unable to sufficiently cool down at night, which increases their risk of heat-related illnesses. People who live alone or lack air conditioning are at even greater risk. Urban heat islands, combined with an aging population, poor air quality, and growing urbanization, are projected to increase the vulnerability of people to heat-related health impacts.
Learn more about heat health for outdoor workers in a story map created by the NIHHIS team. Story maps are web applications that combine maps, images, multimedia content, and narrative text. Open the story map "Protecting Outdoor Workers from Heat Illness" in a new tab/window.
Demand for electricity usually increases during heat waves, leading to potential brownouts and blackouts. To meet this demand, utilities sometimes ask urban hospitals to shift to emergency generators to free up electricity. Because many hospital cooling systems are not connected to back-up power generators, brownouts and blackouts can rapidly increase the number of people affected by an extended heat wave, as patients and those seeking refuge from the heat crowd emergency room lobbies.
Some risks associated with extreme heat-related illness and death have decreased in recent decades, possibly due to better weather forecasting, heat early warning systems, and increased access to air conditioning. Deaths and illnesses due to extreme heat events can be prevented, and advances in our understanding of extreme heat risk and and our ability to predict it, in addition to capacity building and communication, could continue to decrease risk.
To this end, the Centers for Disease Control and Prevention and the National Oceanic and Atmospheric Administration launched the National Integrated Heat Health Information System (NIHHIS) in the summer of 2016. NIHHIS facilitates an integrated approach to heat-heath resilience by providing a suite of decision support services that reduce heat-related illness and mitigate other effects of extreme heat. To learn more about extreme heat and how to protect yourself and others, including those most vulnerable, visit the NIHHIS portal.
Featured Tools
Excessive Heat Events Guidebook: This guidebook gives public health officials background information on risks and impacts of Excessive Heat Events (EHEs) so that they can make a rough estimate of potential local health risks from EHEs. The guidebook also provides a menu of notification and response actions to consider when developing or enhancing a local EHE program.
Heat Safety Tool: This mobile application from the Occupational Safety and Health Administration (OSHA) lets outdoor workers and supervisors calculate the heat index for their worksite. Based on the heat index, the app indicates the risk level to outdoor workers. Users can get suggestions about actions to take at different risk levels to protect workers from heat-related illness. The app is available for Android and iPhone devices, in English and Spanish.
Recognizing, Preventing, and Treating Heat-Related Illness: This course from the U.S. Centers for Disease Control and Prevention (CDC) is designed to help coaches, athletic trainers, students, school nurses, parents, teachers, and others understand heat-related illness in student athletes and know how to prevent, as well as treat, it when it occurs. The course includes tools such as heat index charts, a wet bulb globe temperature chart, and sweat rate calculator that helps leaders assess if it’s safe to play.
- 1a1b1cLuber, G., K. Knowlton, J. Balbus, H. Frumkin, M. Hayden, J. Hess, M. McGeehin, N. Sheats, L. Backer, C. B. Beard, K. L. Ebi, E. Maibach, R. S. Ostfeld, C. Wiedinmyer, E. Zielinski-Gutiérrez, and L. Ziska, 2014: Ch. 9: Human Health. Climate Change Impacts in the United States: The Third National Climate Assessment, J. M. Melillo, Terese (T.C.) Richmond, and G. W. Yohe, Eds., U.S. Global Change Research Program, 220–256. doi:10.7930/J0PN93H5.
- 2White House Report, cited 2014: The Health Impacts of Climate Change on Americans.
- 3a3bUSGCRP, 2016: The Impacts of Climate Change on Human Health in the United States: A Scientific Assessment. A. Crimmins, J. Balbus, J. L. Gamble, C. B. Beard, J. E. Bell, D. Dodgen, R. J. Eisen, N. Fann, M. D. Hawkins, S. C. Herring, L. Jantarasami, D. M. Mills, S. Saha, M. C. Sarofim, J. Trtanj, and L. Ziska, Eds., U.S. Global Change Research Program, 312 pp.
- 4U.S. Environmental Protection Agency, cited 2014: Heat Island Effect.
