Image
Tool
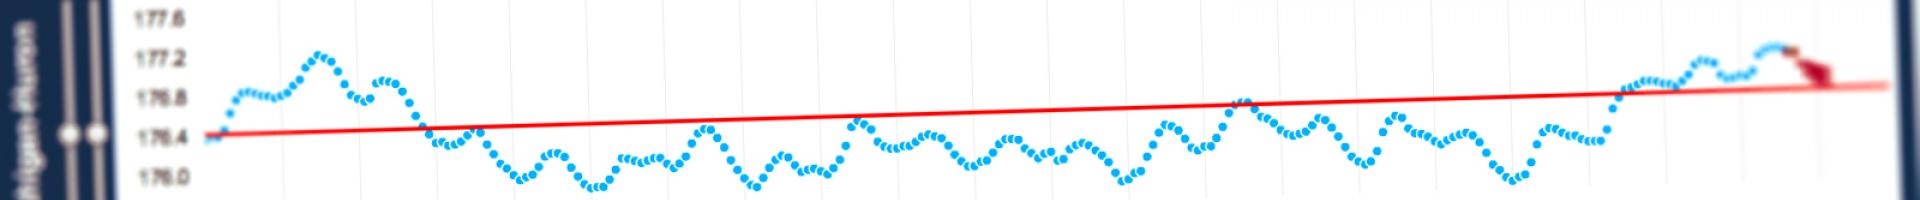
Great Lakes Water Level Dashboard
Water levels of the Great Lakes naturally fluctuate over different time scales in response to weather, climate, and geology. Businesses and residents in the Great Lakes region can use this dashboard to visualize dynamic water levels and seasonal and long-term forecasts.
Users can download monthly Great Lakes water level data and forecasts across a variety of time scales. The dashboard features a sliding time scale that makes it easy to view the past year or the past 150 years.