Image
Tool
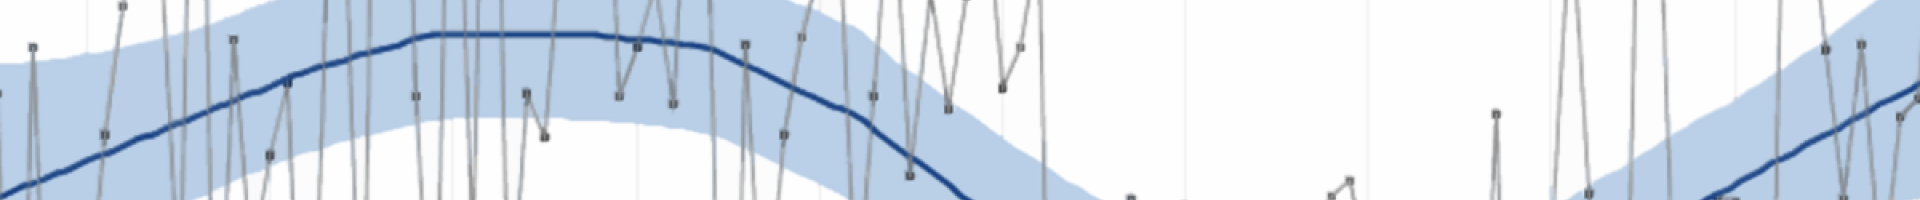
State Temperature Trends
This tool presents historical temperature averages for each of the states in the contiguous United States, displayed as maps or time-series graphs. Users select a state of interest and one of three variables: minimum, mean, or maximum temperature. The tool graphs that state’s trend from 1895 to present. Users can also specify whether they want to display annual averages, or averages for any of the four seasons.
This tool gives users a way to determine whether and how much a given state has warmed or cooled since 1895.
Details
Hazards
