VegScape—Vegetation Condition Explorer
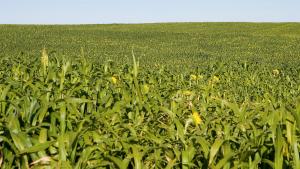
Check daily, weekly, or biweekly data on the health of crops across the contiguous U.S.
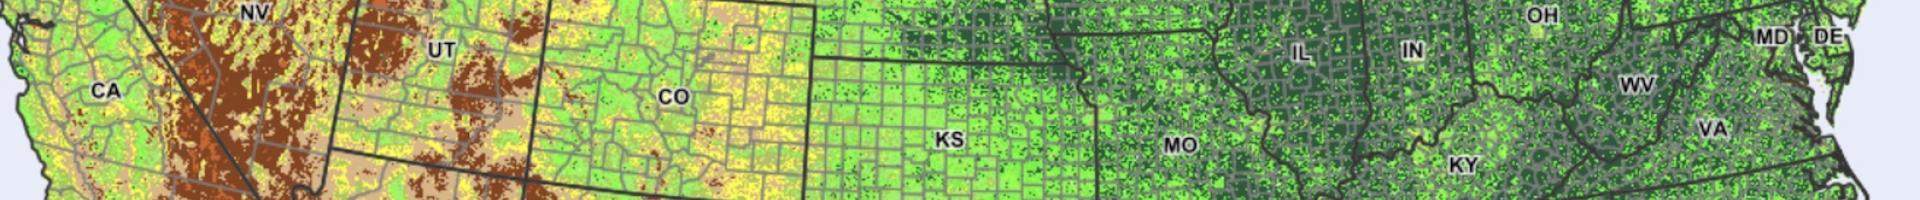
The data come from NASA’s Moderate Resolution Imaging Spectroradiometer (MODIS) instrument aboard NASA’s Terra and Aqua satellites. The reflectance of light at different wavelengths is used to calculate the Normalized Difference Vegetation Index (NDVI) of each field, an indication of how green its plants are. VegScape also allows for visual comparisons of crop health between various years.
As far back as 2000, weekly views of vegetation health enable viewers to examine the effects of crop-damaging incidents over time. Through VegScape, users can assess crop condition and identify the areal extent of floods, drought, major weather anomalies, and vulnerabilities of early/late season crops.