Image
Tool
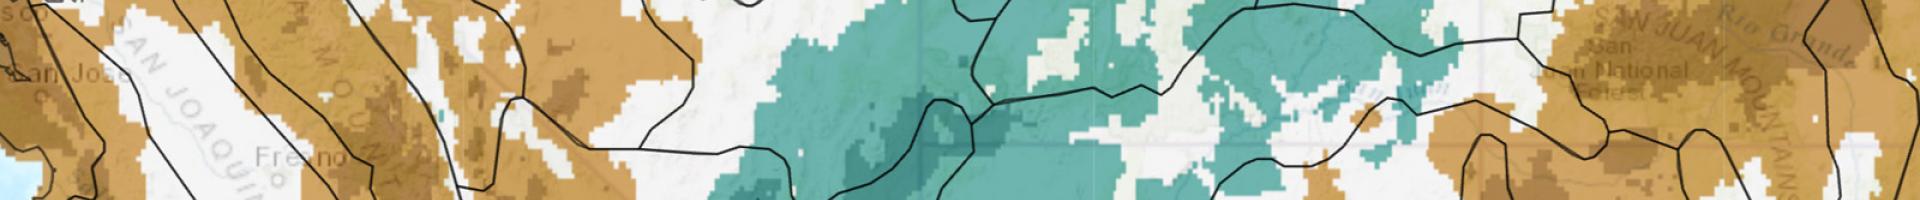
Climate Mapper Tool
The mapper is one of the tools in the Climate Toolbox. It can display summaries of climate and hydrology data from past observations, sub-seasonal to seasonal forecasts, and future projections.
Available maps include specialty metrics for agriculture (growing degree days and chill hours) and fire danger (energy release component and vapor pressure deficit).
Users can customize maps by adding point markers, changing colors, and adding boundaries and other features. The maps are downloadable in geoTIFF and netcdf formats.