Screen capture from the tool website

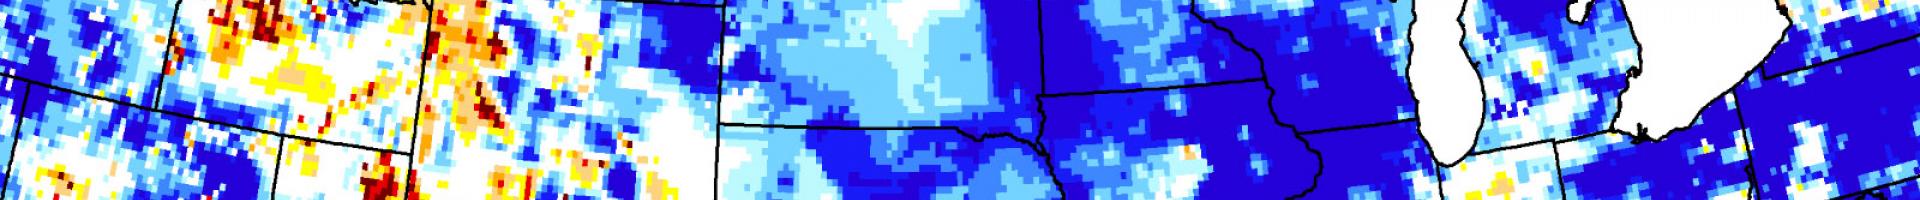
Groundwater and Soil Moisture Conditions from GRACE Data Assimilation

View and download maps displaying drought indicators for the contiguous United States from 2003 to the present, as well as the underlying data.

This website provides current groundwater percentage maps for the continguous United States on a weekly basis, with an archive spanning from 2003 to the present.

Scientists generate groundwater and soil moisture drought indicators each week. The indicators are based on terrestrial water storage observations derived from NASA's Gravity Recovery and Climate Experiment (GRACE) satellite data, which are integrated with other observation using a sophisticated numerical model of land surface water and energy processes. These drought indicators describe current wet or dry conditions expressed as a percentile, showing the probability of occurrence within the period of record from 1948 to the present. Lower values (warm colors) mean dryer than normal, while higher values (blues) mean wetter than normal.

The maps are downloadable in PDF or JPG format, and the underlying data can be downloaded as binary data files. The site also provides a map comparison slider, allowing users to compare views of how conditions changed over time.

Last modified
10 May 2024 - 12:15pm