Stressors and impacts
In the lengthening growing seasons of our changing climate, the past is not always the best predictor of the future. Changes in climate bring new challenges that can impact crops, farmers’ livelihoods, and local economies.
To make their best business decisions in the face of uncertainty, farmers need to monitor how weather and climate are affecting their crops. Up-to-date, reliable data on what crops are growing across the country, and how healthy they are, can help farmers see how their operations fit into the broader landscape of food production. Farmers can use this type of data to help them make decisions about land management, crop selection, and timing for planting and harvesting.
Providing a bird’s-eye view of American agriculture
The United States Department of Agriculture provides two interactive mapping tools—VegScape and CropScape—that enable farmers and others to access useful agricultural information in their Internet browsers. These tools bring the power of geographic information systems (GIS) software to desktop computer users, eliminating the need for specialized software, extra computing power, and lengthy training courses. Experienced GIS users who want to download data files and perform their own analyses can do so, but these skills and assets are not necessary to use these valuable tools.
CropScape
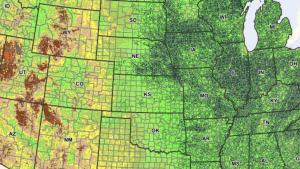
The CropScape tool displays data from the Cropland Data Layer (CDL), an annual, remote-sensing snapshot of crop cover in the contiguous United States during the main growing season. Decades of work involving digitized field boundaries and confirmed crop types (ground truthing) led to an automated process by which a computer algorithm interprets the type of crop growing in each field from satellite data.
Within CropScape, users can find data on the type of crop planted in fields each year dating back to 1997. Examining sequences of annual views provides a historical perspective on how the landscape of American agriculture is changing. For instance, a look at the regions growing corn and soybeans over the last 15 years shows those crops moving to the north; this is consistent with the trend toward longer growing seasons in the northern United States.
VegScape
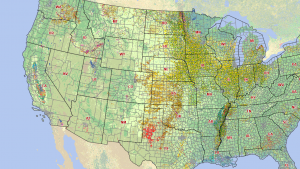
The VegScape tool shows daily, weekly, or biweekly data on the health of crops across the contiguous United States. The data come from NASA’s Moderate Resolution Imaging Spectroradiometer (MODIS) instrument aboard NASA’s Terra and Aqua satellites. The reflectance of light at different wavelengths is used to calculate the Normalized Difference Vegetation Index (NDVI) of each field, an indication of how green its plants are. VegScape also allows for visual comparisons of crop health between various years.
As far back as 2000, weekly views of vegetation health enable viewers to examine the effects of crop-damaging incidents over time. For instance, low NDVI values across California in the summer of 2014 reveal the extent of severe drought conditions. Careful analyses of daily and weekly imagery in VegScape can also reveal the growth of early and late season crops planted outside the main growing season.
Useful tools for a changing climate
Together, CropScape and VegScape enable food producers to visualize and quantify the cover and health of today’s crops, and to compare them to data from more than 10 years into the past. In planning for future growing seasons, growers can tap into these data to examine real-world examples of how crops have fared under known conditions.


