Should your risk assessment be qualitative or quantitative?
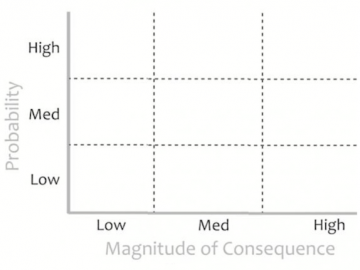
As directed in these pages, communities often begin using qualitative methods for their assessment, categorizing vulnerability and risk as low, medium, or high. This approach is fairly quick and effective for identifying which assets represent your highest risk. When setting priorities for the most important parts of a complex system, however, groups often choose to do the extra work it takes to quantify vulnerability and risk.
To zero in on specific locations where resilience-building can benefit the entire community, many groups choose to access detailed spatial information and quantitative data on hazards and property values. To work in a real community, this quantitative information about physical assets needs to complemented by social awareness and a commitment serve the entire community.
Quantitative geospatial information may be available as web-accessible map layers. Data available in this format make it relatively easy to calculate and display measures of vulnerability and risk across the community. Maps produced using these methods can display the severity of potential hazards and highlight locations where risk is high. Using a map-based quantitative approach also helps reduce uncertainty, making it easier for your team and decision makers to set priorities.
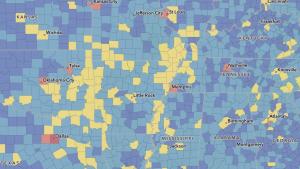
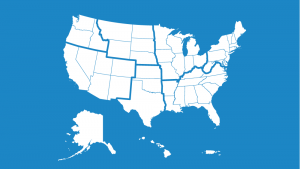
Check FEMA's National Risk Index
Maps in the National Risk Index give users a way compare data related to occurrences of 18 natural hazards across the United States. Access the interactive online mapping application from FEMA to check your community's status. Learn more in the National Risk Index Primer.
Where should you start?
In general, groups choose to address their highest risk first. However, if you recognize that damage to a specific asset (for example, a heavily used bridge or your telecommunications capacity) could initiate multiple failures across other sectors in your community, consider that asset as a top priority. Think about the things your community truly depends upon to function, and use that knowledge to set your priorities.
Do you need to hire a consultant?
Be aware that many communities choose to hire consultants, adaptation practitioners, or Architecture and Engineering (A&E) firms to assist them in compiling their vulnerability and risk assessments. Professionals who fill these roles still need plenty of input from the local champion and team, but they can help groups navigate unfamiliar concepts and document the most pressing potential climate problems in your community.