Image
Tool
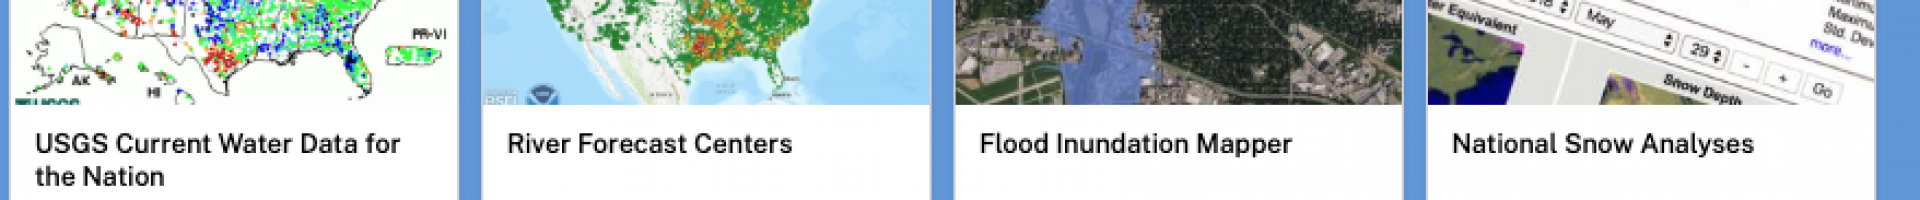
Water Resources Dashboard
Water resource managers and urban planners use this dashboard for convenient access to maps and data that help them monitor the potential for extreme precipitation and drought in their regions. The dashboard offers tools in four main categories:
- Forecasts and Outlooks
- Current Observations
- Historical Observations
- Climate Change
Details
Hazards
Assets