The City of Portland, Oregon is known for its eco-friendliness. In addition to innovative policies and actions to encourage use of mass transit and renewable energy, departments across the city are embracing the need to plan for climate change
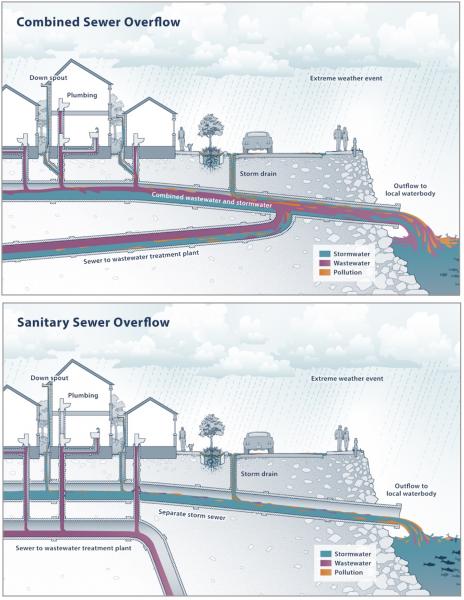
The city’s Bureau of Environmental Services handles stormwater and sewer management for more than 650,000 customers across the metropolitan area. The infrastructure the city relies on to handle this task is a mix of combined sewer systems in the older parts of the city, with separated storm and sewer systems in the outer edges of the city to the east and west.
Facing the future, starting with the past
Portland’s 2019 Climate Resiliency Report concluded that the City’s future climate will be characterized by hotter, drier summers, and warmer, wetter winters, increasing the risk of local and riverine flooding as well as landslides. In response, the Bureau of Environmental Services wanted to examine the basis of their regulatory design standards for stormwater and storm sewer management. This would give them an opportunity to test their resilience to climate change, especially as it affects basement flooding.
First, Bureau personnel needed to understand rainfall changes by gathering historical data. While studying the source of current rainfall statistics, they found little documentation about the origin of the City’s design storms. The storms were found to be based mainly on one rain gage using data from 1945-1990.
Examining more recent data from their rain gage network, they found that precipitation varies by geography. In general, the eastern side of the city is wetter, the western side is dryer, and the central area is a mix of each. Once they added this geographic variability to the overall uncertainty in precipitation data, planners realized that a single design storm might not be able to describe rainfall for the whole city. The planners perceived that many of the disadvantages of using a single design storm could be avoided by using long-term continuous simulations, either directly from local monitored data, or representative future conditions.
Next, analysts attempted to calculate the projected size of future rainstorms from downscaled climate models. The goal was to get a science-supported estimate of how much stormwater they may face in future decades. In the course of this effort, staff gained insight into the uncertainties introduced when using multiple climate models; they also recognized the deep uncertainty inherent in downscaling of model results.
An elusive piece of information they needed was sub-daily rainfall intensity. The group could not find a method to infer sub-daily intensities from daily precipitation volumes or to correlate observed peak daily intensities with peak daily volumes with confidence. This was especially problematic as the relationship of precipitation volume and intensity may change under a changing climate. Planners did not think it was safe to assume that short, intense storms would change by the same amount as multi-day, high-volume storms. Assumptions about these changes could be significant because high intensity and high-volume events could affect the city’s smaller green infrastructure facilities and large projects such as CSO (combined sewer overflow tunnels differently.
Making decisions under deep uncertainty
Shifting gears, analysts turned to methods of decision making under deep uncertainty. This change in approach departed from conventional engineering practice. It required some open-mindedness from the engineers involved and will require a cultural shift as more water professionals adopt its use. Analysts tried two decision making processes: 1) A qualitative approach—scenario planning—helped identify potential adaptation strategies for a constructed wetland facility, and 2) a pilot study for a quantitative approach—sensitivity analysis—was performed for an area of the city where a high quality model of the combined sewer system had already been developed.
Our sensitivity analysis approach
The sewer basin model simulated runoff into the sewer system from rain falling on different urban land uses. The model also tracked the hydraulics of those flows as they filtered through green infrastructure, along pipes of different sizes, and eventually into the interceptors and CSO tunnels leading to the treatment plant. In places where flows in the sewer exceeded the capacity of the pipes, the maximum depth of backups was compared to basement elevations. This enabled the group to estimate risk of backups.
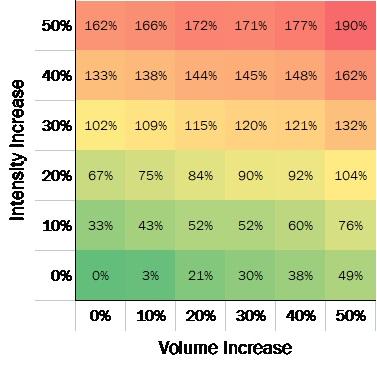
The sensitivity analysis stressed the modeled system by making changes to the simulated rainfall event, also known as the design storm. They were able to vary the peak intensity of precipitation over the baseline—from 10% to 50% more intense in increments of 10%. On another scale, they varied the peak volume of precipitation over baseline -- also 10% to 50% greater volume.
What lesson did we learn?
The system was more susceptible to higher intensity than to higher volume, but the worst-case scenario was a combination of the two. Staff were already aware of the higher sensitivity to intensity but had not explored how much additional risk manifested in the system as that intensity was stress tested.
Planners knew the City couldn’t afford the work it would take to eliminate all risk, so they needed a clear basis for identifying relative levels of risk. This would help them address the highest risk first.
Setting Priorities
To help prioritize investments, the project analysts made rough economic estimates of climate impacts that would result in a favorable cost-benefit analysis for large-scale projects such as trunk upsizing or for targeted local improvements with green infrastructure. The analysis also showed which parts of the system are likely to be the first to experience new risk, suggesting a sequence in which climate resilience projects should be pursued.
Finding this approach to be a useful basis for a cost-benefit analysis and for prioritizing investments, this analytical method demonstrated merit for decision-making under uncertain future conditions for the Bureau. Bureau personnel agreed the approach will be applied to all basins across the city to inform resilience planning. The process will screen the collection system for increased risk of failure under climate change. Also, by assuming higher consequences of failure in areas with greater social vulnerability, the city also has a way to identify projects that can help protect frontline communities from some impacts of climate change. This approach will also help the city avoid overly conservative blanket policy that results in costly increases in facility sizes with uncertain benefits.
In retrospect, engineers in the Bureau of Environmental Services agree that stress testing is a good methodology; it helps them understand how each system’s basin reacts to different types of storm design changes and lets them study a range of potential future risk in the system. The method can also show, when storms do increase in intensity or volume, which areas of the community may be impacted first, which areas may remain resilient in any scenario, and which areas of the community require continual monitoring or infrastructure mitigation. The final category, regardless of location, includes critical infrastructure such as emergency transportation routes, hospital access, community centers, and other facilities that play critical roles in the community.


