Home
Main navigation
  • Mega Menu Icon
    Image
    case study icon
    Browse Case Studies
    • Filtered by hazard
      • Drought
      • Extreme Heat
      • Coastal Flooding
      • Flooding
      • Wildfire
    • Filtered by asset
      • Agriculture
      • Community Services
      • Critical Facilities
      • Economy
      • Energy
      • People
      • Property
      • Natural Areas
      • Transportation
      • Water Infrastructure
  • Mega Menu Icon
    Image
    data and tools icon
    Browse Tools
    • Filtered by hazard
      • Drought
      • Extreme Heat
      • Coastal Flooding
      • Flooding
      • Wildfire
    • Filtered by asset
      • Agriculture
      • Community Services
      • Critical Facilities
      • Economy
      • Energy
      • People
      • Property
      • Natural Areas
      • Transportation
      • Water Infrastructure
  • Mega Menu Icon
    Image
    funding icon
    Browse Funding & Capacity
    • Funding & Building Capacity
    • Search for Funding Opportunities
    • Grant Development Resources
    • Overview
    • Get Started
    • Understand Exposure
    • Assess Vulnerability & Risk
    • Investigate Options
    • Prioritize & Plan
    • Take Action
  • Mega Menu Icon
    Image
    popular resources icon
    Browse Popular Resources
    • Announcements
    • Steps to Resilience
    • New to the Toolkit?
    • Help Desk
    • Glossary
    • Case Studies
    • Tools
    • Trainings
    • Options Database
    • Organizations
    • Workforce Development
    • Topics & Sectors
    • Regions
    • Hazards
    • Assets

Breadcrumb

  1. Home
Image
  • Idaho's High Divide. Image Credit: Mason Cummings, The Wilderness Society

  • Mapping Wildland Values and Climate Change Vulnerability
    Image
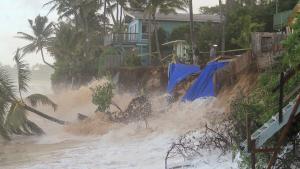
  • Sunset Beach is slammed by waves when high tide combined with high surf in the winter of 2013–2014. Photo courtesy of the University of Hawai‘i Sea Grant College Program (Hawai‘i Sea Grant).

  • Confronting Shoreline Erosion on O‘ahu
    Image
    Two ascending graph lines
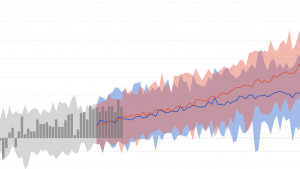
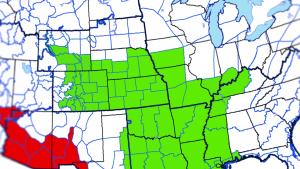
  • Screenshot from the Climate Explorer.

  • Climate Explorer
    Image
    Weather-Ready Nation | Extreme Heat Social Media Toolkit
    Image
    Residential Energy Demand Temperature Index
    Image
    FEMA All Hazards Mobile App
    Image
    Ready Campaign | Extreme Heat Safety Social Media Toolkit
    Image
    Aquatic Connectivity Assessment and Prioritization Tool
    Image
    Flood Resilience Checklist
    Image
    North American Seasonal Fire Assessment and Outlook

    Pagination

    • First page « First
    • Previous page ‹ Previous
    • …
    • Page 75
    • Page 76
    • Page 77
    • Page 78
    • Current page 79
    • Page 80
    • Page 81
    • Page 82
    • Page 83
    • …
    • Next page Next ›
    • Last page Last »
    Subscribe to

    Climate.gov
    • News & Features
    • Teaching Climate
    • Maps & Data
    • FAQs
    Main Menu
    • About
    • FAQ
    • Contact
    • Acknowledgments
    • Sitemap
    Latest
    • Funding Opportunities
    • Glossary
    • Announcements
    Partners
    • climate.data.gov
    • climate.gov
    • USA.gov
    • NEMAC
    Toolkit
    • Case Studies
    • Tools
    • Funding
    • Steps to Resilience
    • Popular Resources

    Climate Resilience Toolkit home link

    Required Footer Links
    • NOAA Privacy
    • Accessibility
    • FOIA
    • Information Quality
    • No-FEAR Act
    • Ready.gov
    • USA.gov