
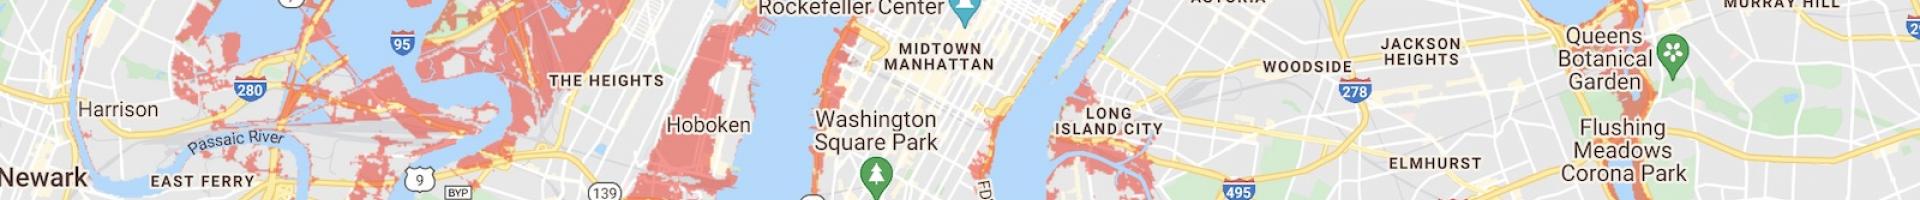
Coastal Risk Screening Tool
Climate Central’s global mapping interface, available in English and Spanish, offers multiple ways to check who/what is threatened by sea level rise and coastal flooding:
Map By Year
The year map gives users a way to explore coastal flood risk and sea level rise projections by decader for nearly anywhere in the world, and under multiple pollution scenarios.
Map By Water Level
The water level map gives users a way to explore what land is at risk from specific water levels that could be reached sea level rise, tides, and/or storm surge.
Affordable Housing
The affordable housing map gives users a way to explore what affordable housing in the U.S. could be threatened by sea level rise and coastal flooding in the coming decades, by state, city, county, congressional district, state legislative district, or zip code.
Ice Sheet Contributions to Sea Level Rise
The ice sheets map gives users a way to explore how much land different amounts of Antarctic ice loss could put below the tideline.
Map By Elevation Data
This interactive map highlights the importance of accurate elevation data for assessing coastal flood risks.