Water, water everywhere
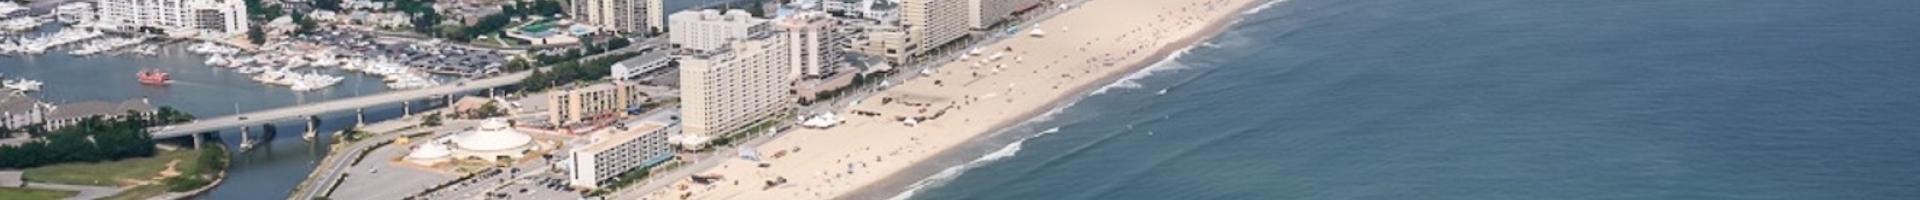
The Hampton Roads region of Virginia is experiencing the highest rate of sea level rise on the East Coast. To make matters worse, rainfall rates in Virginia Beach have increased by 10 percent since the last publication of the NOAA Atlas 14 (a 2006 report detailing national precipitation levels), causing recurrent flooding of roads, homes, and businesses and an assortment of water quality problems.
Virginia Beach's City Manager, recognizing that solutions to these challenges involved multiple departments, consolidated all stormwater functions into a single engineering center to comprehensively address the manifold causes of flooding. The city’s stormwater management plan, dating from the 1990s, also received an update. With this scaffold in place, the Department of Public Works launched its Virginia Beach Sea Level Wise study to identify all-inclusive, city-wide strategies to reduce flooding and protect water quality.
Where does all the water go?
The city’s new Stormwater Engineering Center initiated the study with a detailed inventory and performance assessment of its Stormwater Master Plan. The study revealed that the existing stormwater system models were very rudimentary, accounting for only a fraction of the physical system they were designed to represent.
For example, in their detailed inventory of the physical stormwater system staff documented more than 3,000 nodes (points where runoff exits in one area) and almost 14,000 conduits (channels or pathways for water flow) in the Thalia Basin. In the existing model, this physical system had been represented by only 46 nodes and 58 conduits.
Using models for visualization and public engagement
To improve the situation, modelers used PCSWMM, professional stormwater modeling software, to develop a dynamic model for stormwater runoff. They also used another software program called MIKE 21 Spectral Waves to incorporate wind-driven tides into the model.
Because more than half of rainfall occurs during times when tides elevate water levels, modelers integrated joint probability studies and accounted for rainfall and surge correlation. They also replaced outdated NOAA Atlas 14 data with revised precipitation trends and probable maximum precipitation statistics. To consider sea level rise, they incorporated the ability to consider flooding after 1.5 to 3 feet of sea level rise. Finally, the modelers successfully validated the performance of their dynamic models using eyewitness photos of actual flooding events taken by local citizens.
Once validated, the model was used to identify areas of potential flooding under both normal conditions and during 2-, 10-, 25-, 50-, and 100–year storms. Based on this information, engineers devised adaptive solutions and presented their options to citizens. Animated visualizations to illustrate the benefits of, for example, expanding the 100-year flood zone and installing new infrastructure to avert lesser floods, helped achieve resident buy-in for the plan.
Reflecting on the process
This comprehensive work, the Sea Level Wise Adaptation Strategy, is a holistic framework to guide adaptation efforts across the city. The Stormwater Engineering Center now plays a key role in the city’s resilience by managing flooding, including informing the city’s budgeting, land use planning, codes, incentives, outreach, partnerships, and, most importantly, project implementation.
Public Works Project Manager C. J. Bodnar, reflecting on the project, said that the biggest challenge was being the first city to tackle these issues on a comprehensive scale. Lack of best practices incentivized study leaders to write the playbook they wish they’d had and, in the process, develop a framework that other cities can follow. His advice to others?
- Know what you have (infrastructure/gauge data, etc.) and what you are currently experiencing (flood pictures, high water marks, etc.) before you start the process.
- One of the most valuable data sources was the USGS gauges installed to monitor rainfall and tide elevations. Having actual real-time data during a storm event enabled them to be able to accurately validate their models.
- A social vulnerability analysis should be part of the prioritization ranking procedures, including bonus points when a project provides flooding relief in an area that is determined socially vulnerable.