Flooding four feet deep
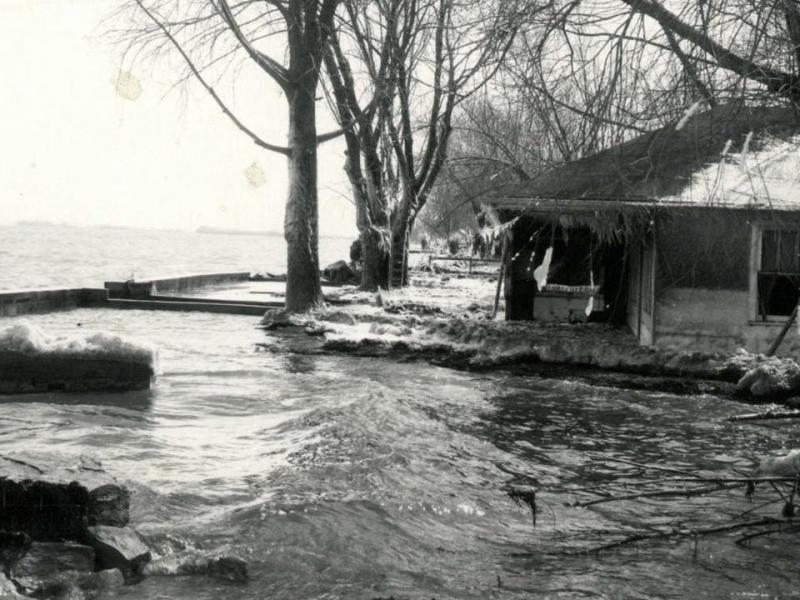
In April 1973, a nor'easter blowing across Lake Michigan's Green Bay resulted in a storm surge that brought four feet of water into downtown Green Bay, Wisconsin. Parking lots and low-lying sections of town were inundated and boats ferried people from their homes and businesses to evacuation centers as the waters reached the 500-year flood mark. The city took months to recover, and the flood is still recalled as one of the area's most extreme events.
The flooding was the result of storm surge: strong winds blowing the already elevated waters of Green Bay across the length of the bay and up onto the adjacent lands. Significant erosion occurred on the open coast of the lake, and damage in the City of Green Bay was estimated at several million dollars.
Understanding the elements of coastal floods
Though the 1973 storm occurred during a period of generally high lake levels, coastal storms can also cause flooding when lake levels are low. For example, a winter storm in December 1990 produced the highest recorded water level in Lake Michigan at the Green Bay gage, and the second highest level was recorded on December 9, 2009, during a storm surge event. Lake levels during both of those events were at or below the average level for the period of record (1918–present).
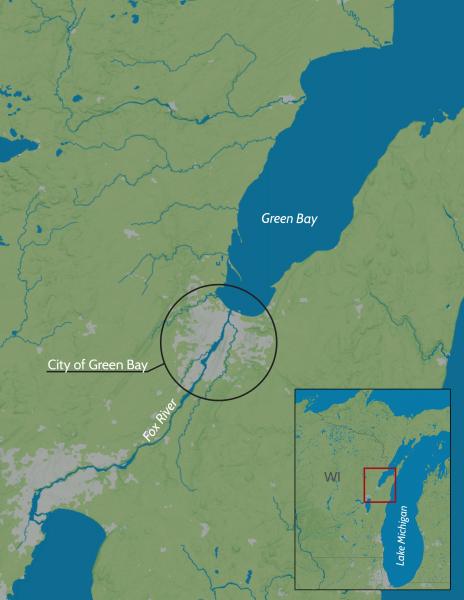
Extreme waves and storm surge can also cause flooding in areas that are inland from the coast. The City of Green Bay is located at the mouth of the Fox River—one of the largest northward-flowing rivers in the United States—and land at the south end of the bay is relatively flat. This geography makes the area vulnerable to storm surges, and the potential for widespread flooding increases when coastal storms combine heavy rainfall with storm surge that can move inland through the river system.
While storm surge and waves are the primary cause of Great Lakes coastal flooding, other factors can influence flooding as well. Lake levels vary as a result of natural processes, but human activity can influence them. For example, some lakes have water regulation structures that provide some degree of control over water levels. Even more significantly, human activities that are modifying our global climate have changed Great Lakes climate in ways that impact lake levels, such as increased evaporation, decreased winter ice cover, and more intense storms with heavier rainfall.
Communicating the risk
Coastal managers are always looking for the best ways to communicate about changing risks for property owners and other stakeholders.
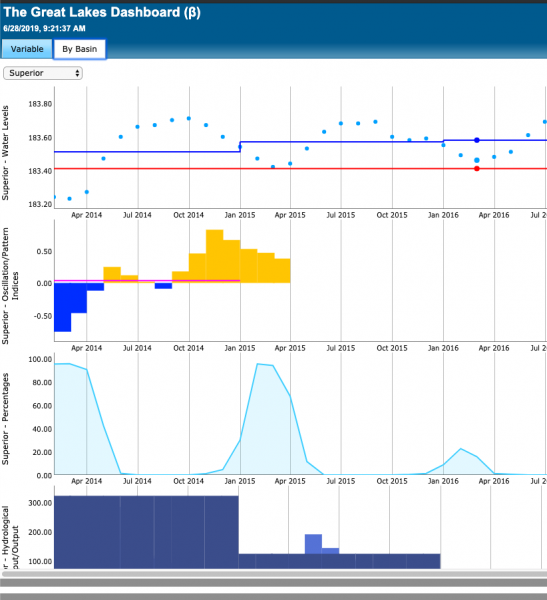
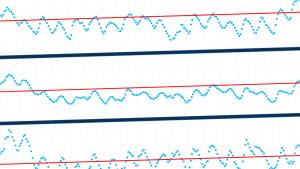
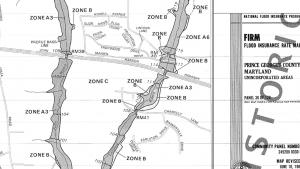
Tools are available to help individuals and communities plan for flooding in a changing climate. Current and historic water levels for the Great Lakes can be obtained via tables and reports from NOAA Tides & Currents. Base Flood Elevation (BFE) values developed by the Federal Emergency Management Agency (FEMA) can be found in FEMA’s Flood Map Service Center. The Great Lakes Water Level Dashboard developed by NOAA and the Army Corps of Engineers provides an interactive viewer to explore historic and future projections of water levels for the Great Lakes.
But charts, graphs, and statistics aren't always enough to help people fully understand the risks of coastal flooding. In some situations, visuals can do a better job of conveying the potential impacts of coastal change.
The Lake Level Viewer
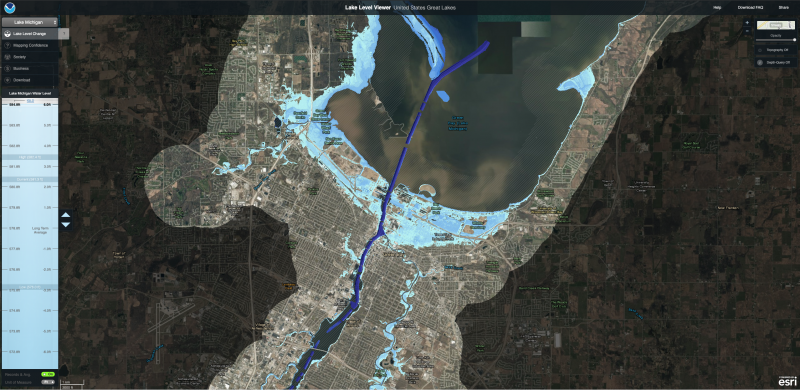
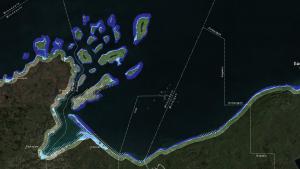
The Lake Level Viewer incorporates detailed elevation data to help users visualize lake level changes ranging from six feet above to six feet below the historical long-term average. The map view shows shoreline and inland impacts for potential flooding from various water levels.
The viewer can help communities make smart planning decisions about zoning restrictions and infrastructure (e.g., marinas, intake pipes), encourage sustainability, and restore and conserve natural habitats. In the viewer, water levels are shown as they would appear during calm conditions, and the data and maps illustrate the scale of potential flooding or land exposure for various water levels. City planners, floodplain managers, tribes, business owners, and individuals can download the tool's data, and access services for more in-depth analyses.
CanVis
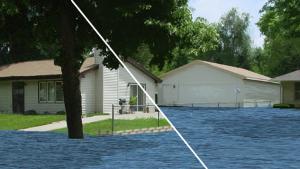
CanVis is a photographic visualization program that can be used to simulate potential impacts from coastal development or changing water levels. Combining simulated imagery from CanVis with inundation mapping or other map-based visualizations can provide context for viewing the various lake level scenarios. For example, this site in the area was chosen to help visualize lake level conditions with a sea wall. The original photo is shown along with the record high lake level and the currently adopted Base Flood Elevations.
Incorporating the results in planning
Coastal managers can use information and visualizations provided by these tools to help stakeholders envision potential natural and human-caused changes before they occur.
Sharing a visualization of likely changes in advance of starting a project, such as constructing a waterfront trail, can help residents get a better sense of how things will change.
Use of simulated maps and images can take away some of the uncertainty, inform the decision-making process, and spur communities to make coastal land use decisions that will be resilient to a changing climate.

